
282
All other alcohols showed an obvious and quite strong rise in their contents for
both solvents. However, it has to be verified if their contents can be sufficient to
form a representative GC peaks in case the solvents are present in the samples alone,
without the eight alcohols control mixture.
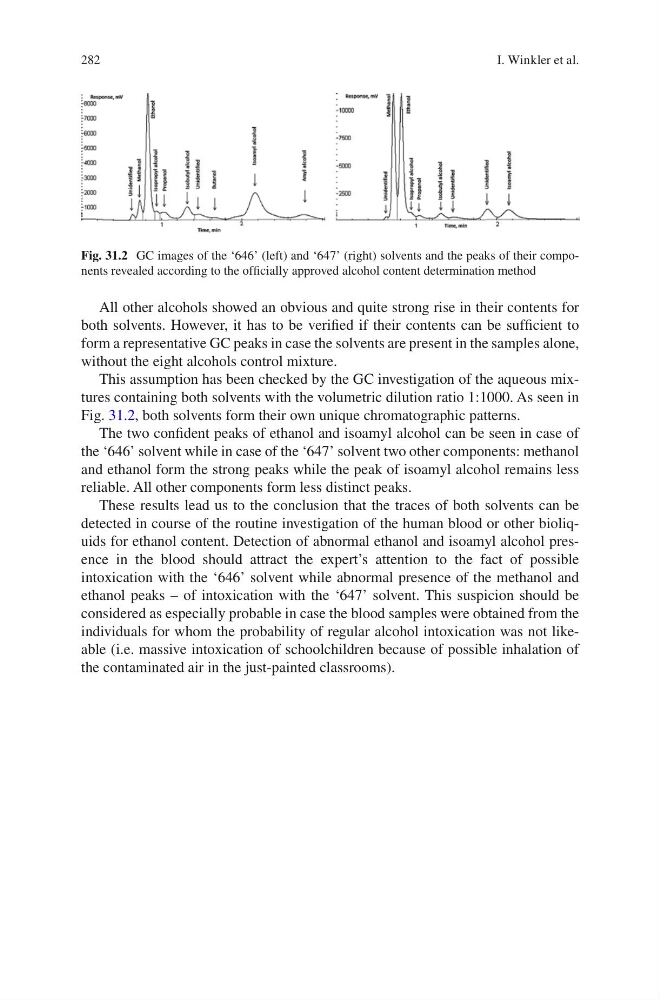
This assumption has been checked by the GC investigation of the aqueous mixtures containing both solvents with the volumetric dilution ratio 1:1000. As seen in
Fig. 31.2, both solvents form their own unique chromatographic patterns.
The two confident peaks of ethanol and isoamyl alcohol can be seen in case of
the ‘646’ solvent while in case of the ‘647’ solvent two other components: methanol
and ethanol form the strong peaks while the peak of isoamyl alcohol remains less
reliable. All other components form less distinct peaks.
These results lead us to the conclusion that the traces of both solvents can be
detected in course of the routine investigation of the human blood or other bioliquids for ethanol content. Detection of abnormal ethanol and isoamyl alcohol presence in the blood should attract the expert’s attention to the fact of possible
intoxication with the ‘646’ solvent while abnormal presence of the methanol and
ethanol peaks – of intoxication with the ‘647’ solvent. This suspicion should be
considered as especially probable in case the blood samples were obtained from the
individuals for whom the probability of regular alcohol intoxication was not likeable (i.e. massive intoxication of schoolchildren because of possible inhalation of
the contaminated air in the just-painted classrooms).
Fig. 31.2 GC images of the ‘646’ (left) and ‘647’ (right) solvents and the peaks of their components revealed according to the officially approved alcohol content determination method
I. Winkler et al.
All other alcohols showed an obvious and quite strong rise in their contents for
both solvents. However, it has to be verified if their contents can be sufficient to
form a representative GC peaks in case the solvents are present in the samples alone,
without the eight alcohols control mixture.
This assumption has been checked by the GC investigation of the aqueous mixtures containing both solvents with the volumetric dilution ratio 1:1000. As seen in
Fig. 31.2, both solvents form their own unique chromatographic patterns.
The two confident peaks of ethanol and isoamyl alcohol can be seen in case of
the ‘646’ solvent while in case of the ‘647’ solvent two other components: methanol
and ethanol form the strong peaks while the peak of isoamyl alcohol remains less
reliable. All other components form less distinct peaks.
These results lead us to the conclusion that the traces of both solvents can be
detected in course of the routine investigation of the human blood or other bioliquids for ethanol content. Detection of abnormal ethanol and isoamyl alcohol presence in the blood should attract the expert’s attention to the fact of possible
intoxication with the ‘646’ solvent while abnormal presence of the methanol and
ethanol peaks – of intoxication with the ‘647’ solvent. This suspicion should be
considered as especially probable in case the blood samples were obtained from the
individuals for whom the probability of regular alcohol intoxication was not likeable (i.e. massive intoxication of schoolchildren because of possible inhalation of
the contaminated air in the just-painted classrooms).
Fig. 31.2 GC images of the ‘646’ (left) and ‘647’ (right) solvents and the peaks of their components revealed according to the officially approved alcohol content determination method
I. Winkler et al.
Précédent