

92
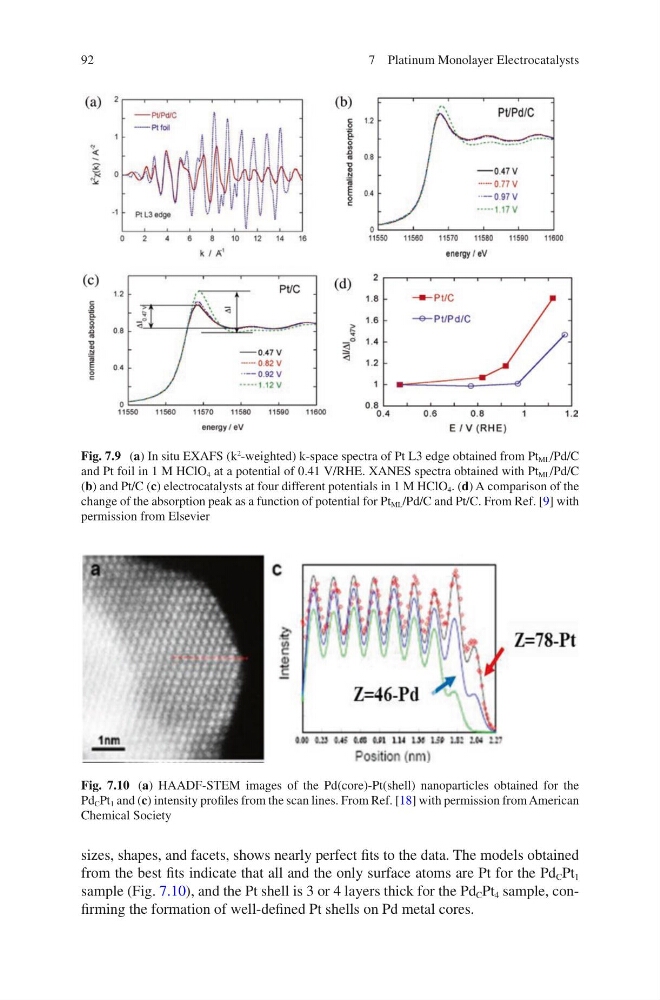
sizes, shapes, and facets, shows nearly perfect fits to the data. The models obtained
from the best fits indicate that all and the only surface atoms are Pt for the Pd C Pt 1
sample (Fig. 7.10), and the Pt shell is 3 or 4 layers thick for the Pd C Pt 4 sample, confirming the formation of well-defined Pt shells on Pd metal cores.
Fig. 7.9 (a) In situ EXAFS (k
2 -weighted) k-space spectra of Pt L3 edge obtained from Pt ML /Pd/C
and Pt foil in 1 M HClO 4 at a potential of 0.41 V/RHE. XANES spectra obtained with Pt ML /Pd/C
(b) and Pt/C (c) electrocatalysts at four different potentials in 1 M HClO 4 . (d) A comparison of the
change of the absorption peak as a function of potential for Pt ML /Pd/C and Pt/C. From Ref. [9] with
permission from Elsevier
Fig. 7.10 (a) HAADF-STEM images of the Pd(core)-Pt(shell) nanoparticles obtained for the
Pd C Pt 1 and (c) intensity profiles from the scan lines. From Ref. [18] with permission from American
Chemical Society
7 Platinum Monolayer Electrocatalysts
sizes, shapes, and facets, shows nearly perfect fits to the data. The models obtained
from the best fits indicate that all and the only surface atoms are Pt for the Pd C Pt 1
sample (Fig. 7.10), and the Pt shell is 3 or 4 layers thick for the Pd C Pt 4 sample, confirming the formation of well-defined Pt shells on Pd metal cores.
Fig. 7.9 (a) In situ EXAFS (k
2 -weighted) k-space spectra of Pt L3 edge obtained from Pt ML /Pd/C
and Pt foil in 1 M HClO 4 at a potential of 0.41 V/RHE. XANES spectra obtained with Pt ML /Pd/C
(b) and Pt/C (c) electrocatalysts at four different potentials in 1 M HClO 4 . (d) A comparison of the
change of the absorption peak as a function of potential for Pt ML /Pd/C and Pt/C. From Ref. [9] with
permission from Elsevier
Fig. 7.10 (a) HAADF-STEM images of the Pd(core)-Pt(shell) nanoparticles obtained for the
Pd C Pt 1 and (c) intensity profiles from the scan lines. From Ref. [18] with permission from American
Chemical Society
7 Platinum Monolayer Electrocatalysts