

91
be obtained from a chemical mapping from electron-energy-loss spectroscopy (EELS).
The element-specific electronic properties, for example Pt 5d-band state, of Pt ML
electrocatalysts and the local environment, such as bond distance and coordination
number of individual components, were obtained using X-ray Absorption Nearedge Structure (XANES) and Extended X-ray Absorption Fine Structure (EXAFS)
spectroscopies, respectively (see Sect. 7.4.2).
Figure 7.9 shows the in situ EXAFS of Pt L3 edge from the Pt ML /Pd/C electrocatalyst in 1 M HClO 4 at various potentials together with those from the reference foil
[9]. Drastic difference between Pt ML /Pd and the Pt foil was observed, especially the
oscillatory behavior in k-space (Fig. 7.9a). The Pt-Pt and Pt-Pd bond lengths are
determined to be 2.729 ± 0.005 Å and 2.724 ± 0.007 Å, respectively, which are
smaller than that of bulk Pt (2.775 Å). The coordination numbers (CN) of Pt-Pt and
Pt-Pd are 5.8 ± 0.8 and 2.7 ± 0.7, respectively. In the case of a complete Pt monolayer
on a Pd(111), the CN of Pt-Pt is 6, while for Pt-Pd, it is 3. Slightly different CNs are
expected for monolayers on nanoparticles, so that the CN of Pt-Pt and Pt-Pd from the
fitting results verify the Pt monolayer formation on Pd nanoparticle surfaces.
Strong evidence of delayed oxidation of a Pt monolayer on Pd nanoparticles in
comparison with the oxidation of Pt nanoparticles was obtained from in situ XANES
measurements as a function of potential. Figure 7.9b shows the Pt L3 edge spectra
obtained on the Pt ML /Pd/C electrocatalysts at four different potentials. Only at the
highest potentials is there an increase in the intensity of white line as a consequence
of the PtOH formation causing a depletion of Pt’s d-band. The increase in the intensity of the white line for the Pt/C electrocatalyst commences at considerably less
positive potentials (Fig. 7.9c and d). This indicates that the oxidation of a Pt monolayer on a palladium substrate requires higher potentials than that of platinum
nanoparticles on a carbon substrate, which is in accord with the voltammetry data [2].
The atomic structures and component distributions of the Pd C Pt n nanoparticles
were examined using an aberration-corrected scanning tunneling electron microscopy (STEM) equipped with electron-energy-loss spectroscopy (EELS). Figure 7.10
shows atomically resolved HAADF (high-angle annular dark field)-STEM images
for the Pd C Pt 1 and Pd C Pt 4 samples, respectively [9]. The analysis of the Z-contrast
HAADF intensity profiles along the scan lines from the center to the edge, using
three-dimensional atomic structural models generated from the observed particles’
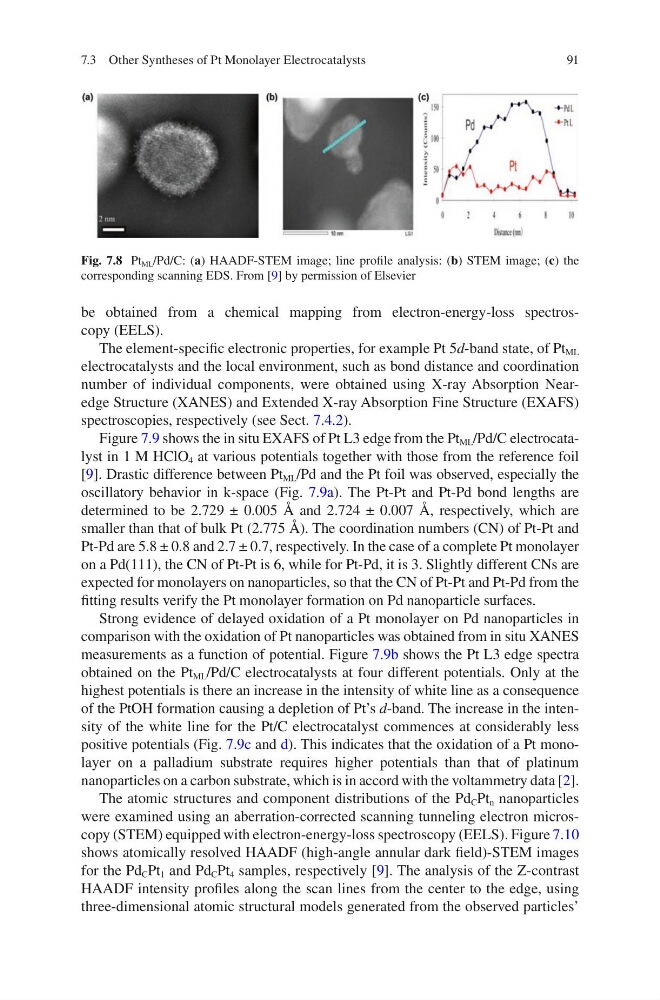
Fig. 7.8 Pt ML /Pd/C: (a) HAADF-STEM image; line profile analysis: (b) STEM image; (c) the
corresponding scanning EDS. From [9] by permission of Elsevier
7.3 Other Syntheses of Pt Monolayer Electrocatalysts
be obtained from a chemical mapping from electron-energy-loss spectroscopy (EELS).
The element-specific electronic properties, for example Pt 5d-band state, of Pt ML
electrocatalysts and the local environment, such as bond distance and coordination
number of individual components, were obtained using X-ray Absorption Nearedge Structure (XANES) and Extended X-ray Absorption Fine Structure (EXAFS)
spectroscopies, respectively (see Sect. 7.4.2).
Figure 7.9 shows the in situ EXAFS of Pt L3 edge from the Pt ML /Pd/C electrocatalyst in 1 M HClO 4 at various potentials together with those from the reference foil
[9]. Drastic difference between Pt ML /Pd and the Pt foil was observed, especially the
oscillatory behavior in k-space (Fig. 7.9a). The Pt-Pt and Pt-Pd bond lengths are
determined to be 2.729 ± 0.005 Å and 2.724 ± 0.007 Å, respectively, which are
smaller than that of bulk Pt (2.775 Å). The coordination numbers (CN) of Pt-Pt and
Pt-Pd are 5.8 ± 0.8 and 2.7 ± 0.7, respectively. In the case of a complete Pt monolayer
on a Pd(111), the CN of Pt-Pt is 6, while for Pt-Pd, it is 3. Slightly different CNs are
expected for monolayers on nanoparticles, so that the CN of Pt-Pt and Pt-Pd from the
fitting results verify the Pt monolayer formation on Pd nanoparticle surfaces.
Strong evidence of delayed oxidation of a Pt monolayer on Pd nanoparticles in
comparison with the oxidation of Pt nanoparticles was obtained from in situ XANES
measurements as a function of potential. Figure 7.9b shows the Pt L3 edge spectra
obtained on the Pt ML /Pd/C electrocatalysts at four different potentials. Only at the
highest potentials is there an increase in the intensity of white line as a consequence
of the PtOH formation causing a depletion of Pt’s d-band. The increase in the intensity of the white line for the Pt/C electrocatalyst commences at considerably less
positive potentials (Fig. 7.9c and d). This indicates that the oxidation of a Pt monolayer on a palladium substrate requires higher potentials than that of platinum
nanoparticles on a carbon substrate, which is in accord with the voltammetry data [2].
The atomic structures and component distributions of the Pd C Pt n nanoparticles
were examined using an aberration-corrected scanning tunneling electron microscopy (STEM) equipped with electron-energy-loss spectroscopy (EELS). Figure 7.10
shows atomically resolved HAADF (high-angle annular dark field)-STEM images
for the Pd C Pt 1 and Pd C Pt 4 samples, respectively [9]. The analysis of the Z-contrast
HAADF intensity profiles along the scan lines from the center to the edge, using
three-dimensional atomic structural models generated from the observed particles’
Fig. 7.8 Pt ML /Pd/C: (a) HAADF-STEM image; line profile analysis: (b) STEM image; (c) the
corresponding scanning EDS. From [9] by permission of Elsevier
7.3 Other Syntheses of Pt Monolayer Electrocatalysts