

93
7.4 In Situ FTIR and Synchrotron X-Ray Absorption
Spectroscopies, and Hydrodynamic Rotating Disk
Electrode Techniques
7.4.1 In situ FTIR Spectroscopy
In situ Fourier Transform Infrared (FTIR) spectroscopy has substantially advanced
our knowledge on various electrochemical systems at a molecular level [19].
Essentially, it is based on internal reflection in which the IR beam traverses from the
internal reflection element (IRE) made of optical denser material (i.e. having high
refractive index) and strikes the solution interface at an angle greater than the critical angle θ c . so that the IR beam totally reflects towards the IRE. Simultaneously, an
evanescent wave is generated and propagates into the rarer medium (solution) to a
depth of 1–3 μm and carries information on the absorption of species in its path. If
the electrode is placed within the penetration depth of the evanescent wave, the
reflected IR radiation also carries information on the species at the electrode surface. Reflectivity signals R o and R s are taken at the reference and sample potential E r
and E s , respectively, and the results are presented as a normalized change in reflectivity, −ΔR/R = −(R s –R 0 )/R 0 . The latter value is proportional to absorbance but can
have both positive and negative bands corresponding to the gain and loss of the
species at sample potential vs that at the reference [20].
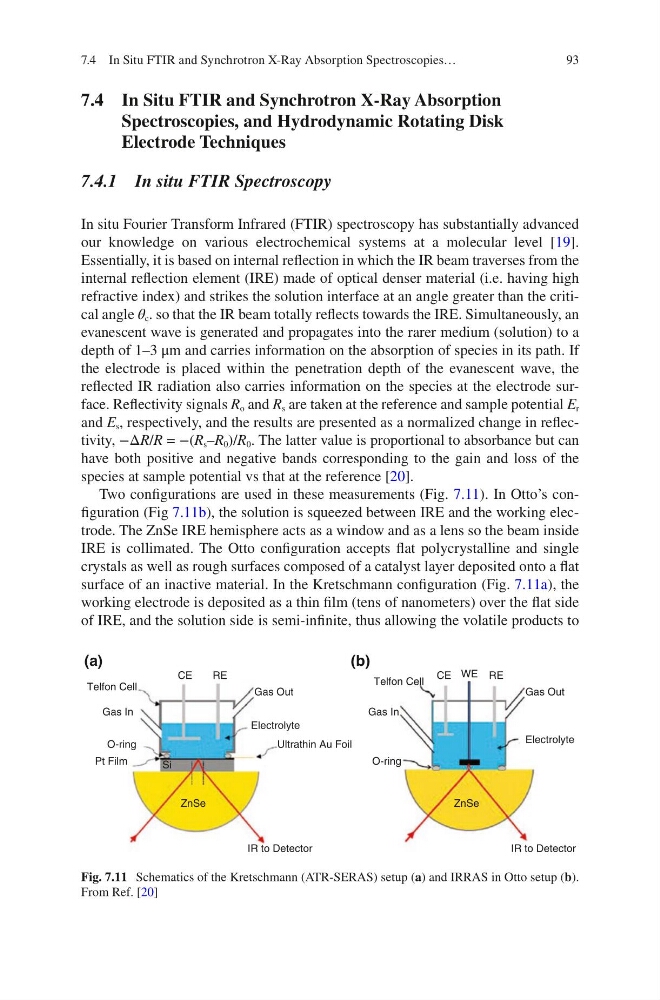
Two configurations are used in these measurements (Fig. 7.11). In Otto’s configuration (Fig 7.11b), the solution is squeezed between IRE and the working electrode. The ZnSe IRE hemisphere acts as a window and as a lens so the beam inside
IRE is collimated. The Otto configuration accepts flat polycrystalline and single
crystals as well as rough surfaces composed of a catalyst layer deposited onto a flat
surface of an inactive material. In the Kretschmann configuration (Fig. 7.11a), the
working electrode is deposited as a thin film (tens of nanometers) over the flat side
of IRE, and the solution side is semi-infinite, thus allowing the volatile products to
Telfon Cell
Telfon Cell
Gas In
Gas In
O-ring
O-ring
Pt Film
Si
ZnSe
ZnSe
Ultrathin Au Foil
Electrolyte
Electrolyte
Gas Out
Gas Out
CE
CE
RE
RE
IR to Detector
IR to Detector
WE
(a)
(b)
Fig. 7.11 Schematics of the Kretschmann (ATR-SERAS) setup (a) and IRRAS in Otto setup (b).
From Ref. [20]
7.4 In Situ FTIR and Synchrotron X-Ray Absorption Spectroscopies…
7.4 In Situ FTIR and Synchrotron X-Ray Absorption
Spectroscopies, and Hydrodynamic Rotating Disk
Electrode Techniques
7.4.1 In situ FTIR Spectroscopy
In situ Fourier Transform Infrared (FTIR) spectroscopy has substantially advanced
our knowledge on various electrochemical systems at a molecular level [19].
Essentially, it is based on internal reflection in which the IR beam traverses from the
internal reflection element (IRE) made of optical denser material (i.e. having high
refractive index) and strikes the solution interface at an angle greater than the critical angle θ c . so that the IR beam totally reflects towards the IRE. Simultaneously, an
evanescent wave is generated and propagates into the rarer medium (solution) to a
depth of 1–3 μm and carries information on the absorption of species in its path. If
the electrode is placed within the penetration depth of the evanescent wave, the
reflected IR radiation also carries information on the species at the electrode surface. Reflectivity signals R o and R s are taken at the reference and sample potential E r
and E s , respectively, and the results are presented as a normalized change in reflectivity, −ΔR/R = −(R s –R 0 )/R 0 . The latter value is proportional to absorbance but can
have both positive and negative bands corresponding to the gain and loss of the
species at sample potential vs that at the reference [20].
Two configurations are used in these measurements (Fig. 7.11). In Otto’s configuration (Fig 7.11b), the solution is squeezed between IRE and the working electrode. The ZnSe IRE hemisphere acts as a window and as a lens so the beam inside
IRE is collimated. The Otto configuration accepts flat polycrystalline and single
crystals as well as rough surfaces composed of a catalyst layer deposited onto a flat
surface of an inactive material. In the Kretschmann configuration (Fig. 7.11a), the
working electrode is deposited as a thin film (tens of nanometers) over the flat side
of IRE, and the solution side is semi-infinite, thus allowing the volatile products to
Telfon Cell
Telfon Cell
Gas In
Gas In
O-ring
O-ring
Pt Film
Si
ZnSe
ZnSe
Ultrathin Au Foil
Electrolyte
Electrolyte
Gas Out
Gas Out
CE
CE
RE
RE
IR to Detector
IR to Detector
WE
(a)
(b)
Fig. 7.11 Schematics of the Kretschmann (ATR-SERAS) setup (a) and IRRAS in Otto setup (b).
From Ref. [20]
7.4 In Situ FTIR and Synchrotron X-Ray Absorption Spectroscopies…