

7.7 Validation based on different joint configurations
149
Shear test
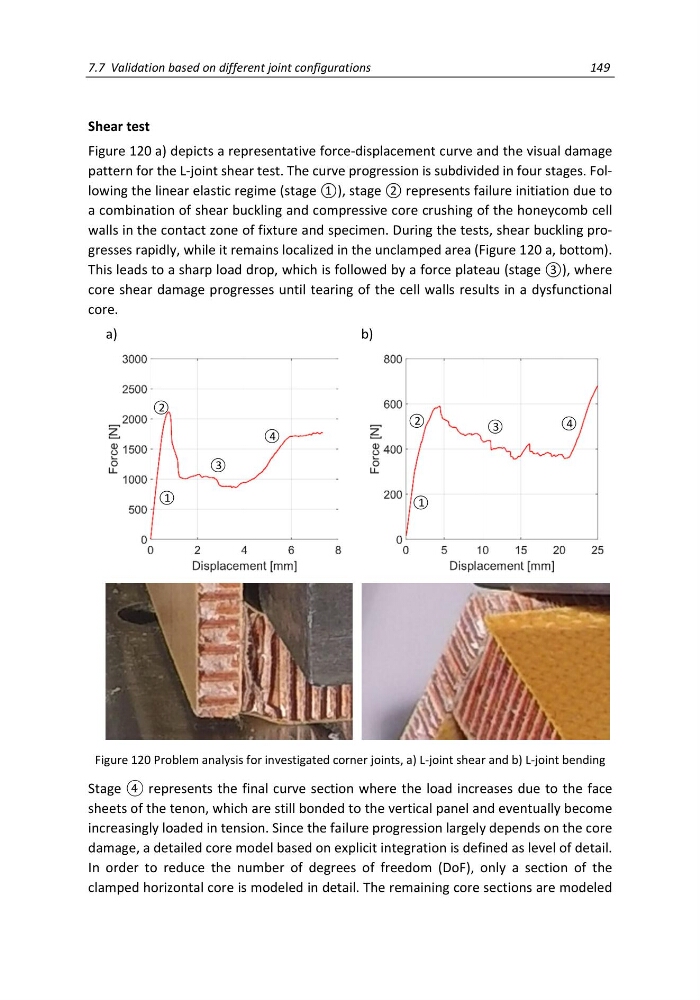
Figure 120 a) depicts a representative force-displacement curve and the visual damage
pattern for the L-joint shear test. The curve progression is subdivided in four stages. Following the linear elastic regime (stage ①), stage ② represents failure initiation due to
a combination of shear buckling and compressive core crushing of the honeycomb cell
walls in the contact zone of fixture and specimen. During the tests, shear buckling progresses rapidly, while it remains localized in the unclamped area (Figure 120 a, bottom).
This leads to a sharp load drop, which is followed by a force plateau (stage ③), where
core shear damage progresses until tearing of the cell walls results in a dysfunctional
core.
a)
b)
Figure 120 Problem analysis for investigated corner joints, a) L-joint shear and b) L-joint bending
Stage ④ represents the final curve section where the load increases due to the face
sheets of the tenon, which are still bonded to the vertical panel and eventually become
increasingly loaded in tension. Since the failure progression largely depends on the core
damage, a detailed core model based on explicit integration is defined as level of detail.
In order to reduce the number of degrees of freedom (DoF), only a section of the
clamped horizontal core is modeled in detail. The remaining core sections are modeled
2
3
4
1
2
3
4
1
149
Shear test
Figure 120 a) depicts a representative force-displacement curve and the visual damage
pattern for the L-joint shear test. The curve progression is subdivided in four stages. Following the linear elastic regime (stage ①), stage ② represents failure initiation due to
a combination of shear buckling and compressive core crushing of the honeycomb cell
walls in the contact zone of fixture and specimen. During the tests, shear buckling progresses rapidly, while it remains localized in the unclamped area (Figure 120 a, bottom).
This leads to a sharp load drop, which is followed by a force plateau (stage ③), where
core shear damage progresses until tearing of the cell walls results in a dysfunctional
core.
a)
b)
Figure 120 Problem analysis for investigated corner joints, a) L-joint shear and b) L-joint bending
Stage ④ represents the final curve section where the load increases due to the face
sheets of the tenon, which are still bonded to the vertical panel and eventually become
increasingly loaded in tension. Since the failure progression largely depends on the core
damage, a detailed core model based on explicit integration is defined as level of detail.
In order to reduce the number of degrees of freedom (DoF), only a section of the
clamped horizontal core is modeled in detail. The remaining core sections are modeled
2
3
4
1
2
3
4
1