

7.4 Phase 3 - Model development
117
The analysis methods can be subdivided in live examination and pre- and post-test analysis. In its most basic form, live examination simply means visual observation of the reference test. This is typically documented using video images if necessary from multiple
angles. It is preferable, if the video images can be related to the test progress, for instance by displaying live test parameters such as force and displacement in the field of
view of the cameras or by feeding this information directly to the camera system. Due
to the often rapid progression of damage, many applications require high-speed cameras
to capture all relevant effects. Video images of the specimen can also be used for digital
image correlation (DIC) given that the specimens are prepared for such analysis. This
enables to determine strain fields over large areas of the specimen. Another form of live
examination of the reference test is recording the acoustic emission, which can help to
identify specific damages such as fiber rupture in the face sheet. Pre- and post-test analyses ensure that the state of the specimen before and after testing is captured and documented. Pre-test analysis is required to determine the necessary geometric input to for
the computational model. In addition, significant imperfections or pre-damages are determined. The post-test analysis identifies all damages after testing. Both analyses apply
similar methods, such as visual inspection, light microscopy, computer tomography (CT)
and thermography. The sum of analysis results and test results yields the physical test
results, which is the main output of this process step. Figure 86 illustrates a flow chart of
the structural tests and analysis methods step.
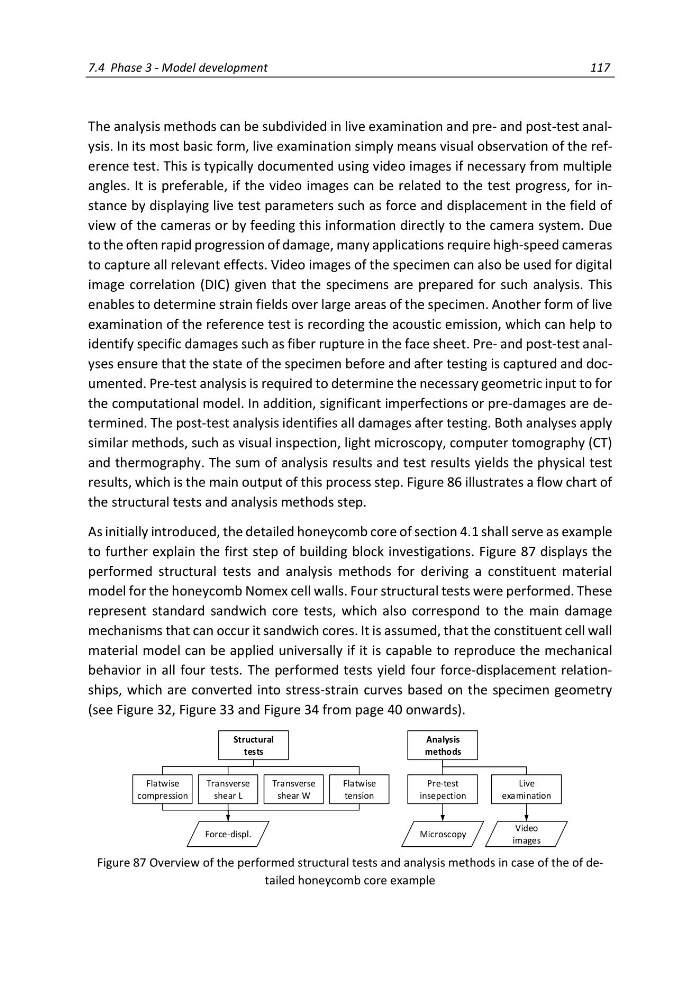
As initially introduced, the detailed honeycomb core of section 4.1 shall serve as example
to further explain the first step of building block investigations. Figure 87 displays the
performed structural tests and analysis methods for deriving a constituent material
model for the honeycomb Nomex cell walls. Four structural tests were performed. These
represent standard sandwich core tests, which also correspond to the main damage
mechanisms that can occur it sandwich cores. It is assumed, that the constituent cell wall
material model can be applied universally if it is capable to reproduce the mechanical
behavior in all four tests. The performed tests yield four force-displacement relationships, which are converted into stress-strain curves based on the specimen geometry
(see Figure 32, Figure 33 and Figure 34 from page 40 onwards).
Structural
tests
Live
examination
Pre-test
insepection
Analysis
methods
Flatwise
compression
Microscopy
Video
images
Transverse
shear L
Flatwise
tension
Force-displ.
Transverse
shear W
Figure 87 Overview of the performed structural tests and analysis methods in case of the of detailed honeycomb core example
117
The analysis methods can be subdivided in live examination and pre- and post-test analysis. In its most basic form, live examination simply means visual observation of the reference test. This is typically documented using video images if necessary from multiple
angles. It is preferable, if the video images can be related to the test progress, for instance by displaying live test parameters such as force and displacement in the field of
view of the cameras or by feeding this information directly to the camera system. Due
to the often rapid progression of damage, many applications require high-speed cameras
to capture all relevant effects. Video images of the specimen can also be used for digital
image correlation (DIC) given that the specimens are prepared for such analysis. This
enables to determine strain fields over large areas of the specimen. Another form of live
examination of the reference test is recording the acoustic emission, which can help to
identify specific damages such as fiber rupture in the face sheet. Pre- and post-test analyses ensure that the state of the specimen before and after testing is captured and documented. Pre-test analysis is required to determine the necessary geometric input to for
the computational model. In addition, significant imperfections or pre-damages are determined. The post-test analysis identifies all damages after testing. Both analyses apply
similar methods, such as visual inspection, light microscopy, computer tomography (CT)
and thermography. The sum of analysis results and test results yields the physical test
results, which is the main output of this process step. Figure 86 illustrates a flow chart of
the structural tests and analysis methods step.
As initially introduced, the detailed honeycomb core of section 4.1 shall serve as example
to further explain the first step of building block investigations. Figure 87 displays the
performed structural tests and analysis methods for deriving a constituent material
model for the honeycomb Nomex cell walls. Four structural tests were performed. These
represent standard sandwich core tests, which also correspond to the main damage
mechanisms that can occur it sandwich cores. It is assumed, that the constituent cell wall
material model can be applied universally if it is capable to reproduce the mechanical
behavior in all four tests. The performed tests yield four force-displacement relationships, which are converted into stress-strain curves based on the specimen geometry
(see Figure 32, Figure 33 and Figure 34 from page 40 onwards).
Structural
tests
Live
examination
Pre-test
insepection
Analysis
methods
Flatwise
compression
Microscopy
Video
images
Transverse
shear L
Flatwise
tension
Force-displ.
Transverse
shear W
Figure 87 Overview of the performed structural tests and analysis methods in case of the of detailed honeycomb core example