

220
13 Metal Cluster Catalysis
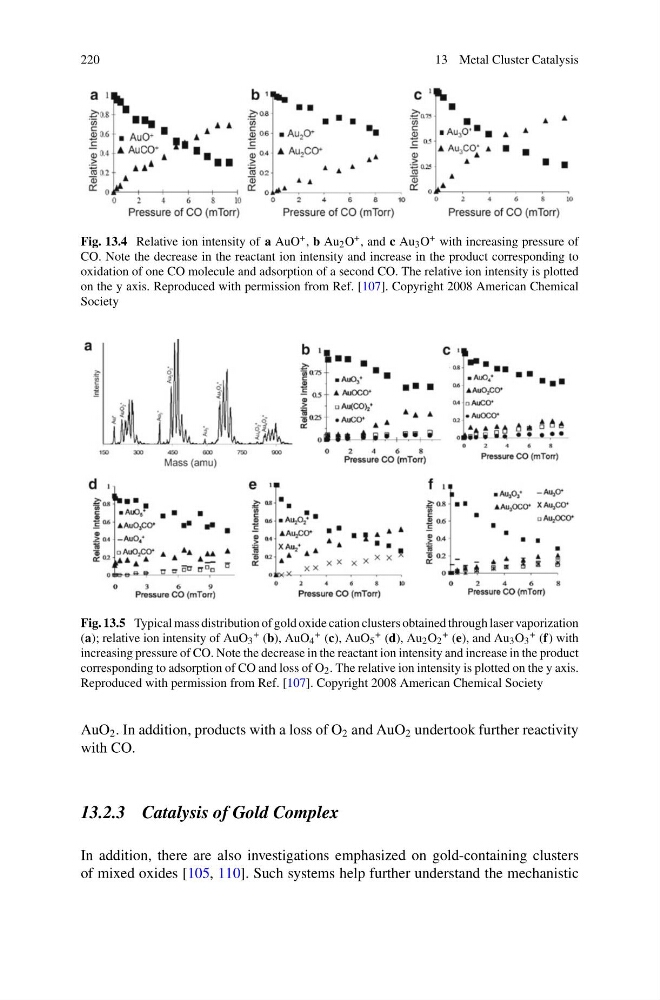
Fig. 13.4 Relative ion intensity of a AuO + , b Au 2 O + , and c Au 3 O + with increasing pressure of
CO. Note the decrease in the reactant ion intensity and increase in the product corresponding to
oxidation of one CO molecule and adsorption of a second CO. The relative ion intensity is plotted
on the y axis. Reproduced with permission from Ref. [107]. Copyright 2008 American Chemical
Society
Fig. 13.5 Typical mass distribution of gold oxide cation clusters obtained through laser vaporization
(a); relative ion intensity of AuO 3
+ (b), AuO 4
+ (c), AuO 5
+ (d), Au 2 O 2
+ (e), and Au 3 O 3
+ (f) with
increasing pressure of CO. Note the decrease in the reactant ion intensity and increase in the product
corresponding to adsorption of CO and loss of O 2 . The relative ion intensity is plotted on the y axis.
Reproduced with permission from Ref. [107]. Copyright 2008 American Chemical Society
AuO 2 . In addition, products with a loss of O 2 and AuO 2 undertook further reactivity
with CO.
13.2.3 Catalysis of Gold Complex
In addition, there are also investigations emphasized on gold-containing clusters
of mixed oxides [105, 110]. Such systems help further understand the mechanistic
13 Metal Cluster Catalysis
Fig. 13.4 Relative ion intensity of a AuO + , b Au 2 O + , and c Au 3 O + with increasing pressure of
CO. Note the decrease in the reactant ion intensity and increase in the product corresponding to
oxidation of one CO molecule and adsorption of a second CO. The relative ion intensity is plotted
on the y axis. Reproduced with permission from Ref. [107]. Copyright 2008 American Chemical
Society
Fig. 13.5 Typical mass distribution of gold oxide cation clusters obtained through laser vaporization
(a); relative ion intensity of AuO 3
+ (b), AuO 4
+ (c), AuO 5
+ (d), Au 2 O 2
+ (e), and Au 3 O 3
+ (f) with
increasing pressure of CO. Note the decrease in the reactant ion intensity and increase in the product
corresponding to adsorption of CO and loss of O 2 . The relative ion intensity is plotted on the y axis.
Reproduced with permission from Ref. [107]. Copyright 2008 American Chemical Society
AuO 2 . In addition, products with a loss of O 2 and AuO 2 undertook further reactivity
with CO.
13.2.3 Catalysis of Gold Complex
In addition, there are also investigations emphasized on gold-containing clusters
of mixed oxides [105, 110]. Such systems help further understand the mechanistic