

100
7 The Reactions with Monoxides for Pollution Removal
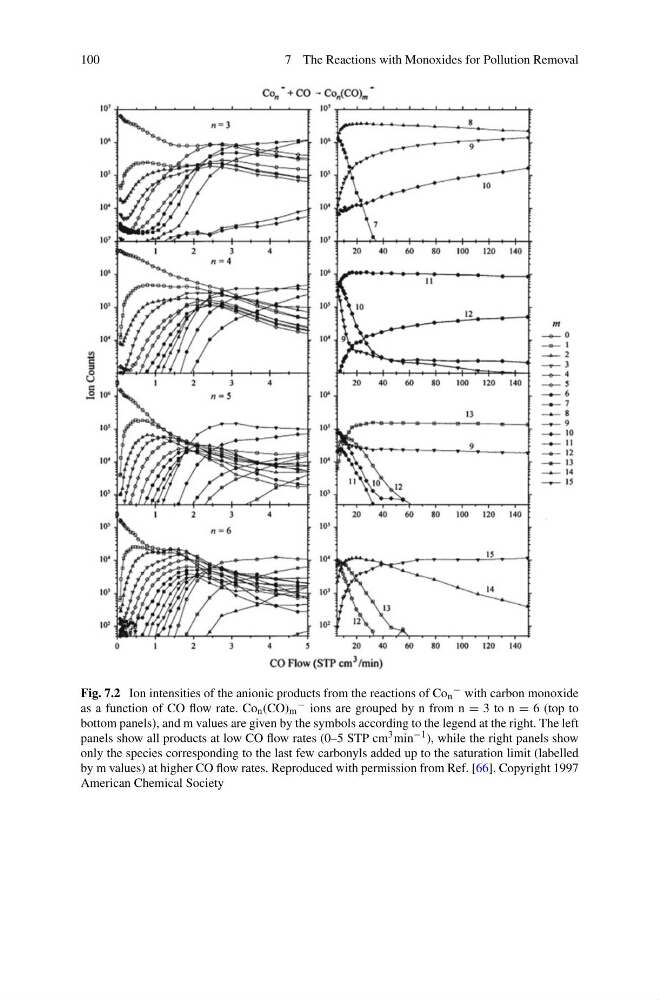
Fig. 7.2 Ion intensities of the anionic products from the reactions of Co n
− with carbon monoxide
as a function of CO flow rate. Co n (CO) m
− ions are grouped by n from n = 3 to n = 6 (top to
bottom panels), and m values are given by the symbols according to the legend at the right. The left
panels show all products at low CO flow rates (0–5 STP cm 3 min −1 ), while the right panels show
only the species corresponding to the last few carbonyls added up to the saturation limit (labelled
by m values) at higher CO flow rates. Reproduced with permission from Ref. [66]. Copyright 1997
American Chemical Society
7 The Reactions with Monoxides for Pollution Removal
Fig. 7.2 Ion intensities of the anionic products from the reactions of Co n
− with carbon monoxide
as a function of CO flow rate. Co n (CO) m
− ions are grouped by n from n = 3 to n = 6 (top to
bottom panels), and m values are given by the symbols according to the legend at the right. The left
panels show all products at low CO flow rates (0–5 STP cm 3 min −1 ), while the right panels show
only the species corresponding to the last few carbonyls added up to the saturation limit (labelled
by m values) at higher CO flow rates. Reproduced with permission from Ref. [66]. Copyright 1997
American Chemical Society