

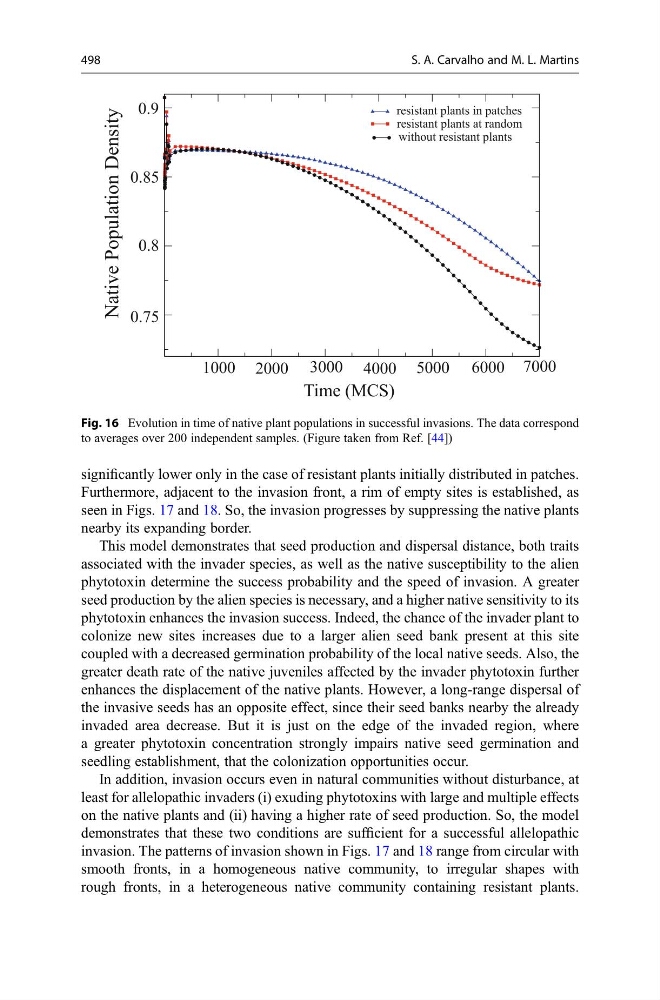
significantly lower only in the case of resistant plants initially distributed in patches.
Furthermore, adjacent to the invasion front, a rim of empty sites is established, as
seen in Figs. 17 and 18. So, the invasion progresses by suppressing the native plants
nearby its expanding border.
This model demonstrates that seed production and dispersal distance, both traits
associated with the invader species, as well as the native susceptibility to the alien
phytotoxin determine the success probability and the speed of invasion. A greater
seed production by the alien species is necessary, and a higher native sensitivity to its
phytotoxin enhances the invasion success. Indeed, the chance of the invader plant to
colonize new sites increases due to a larger alien seed bank present at this site
coupled with a decreased germination probability of the local native seeds. Also, the
greater death rate of the native juveniles affected by the invader phytotoxin further
enhances the displacement of the native plants. However, a long-range dispersal of
the invasive seeds has an opposite effect, since their seed banks nearby the already
invaded area decrease. But it is just on the edge of the invaded region, where
a greater phytotoxin concentration strongly impairs native seed germination and
seedling establishment, that the colonization opportunities occur.
In addition, invasion occurs even in natural communities without disturbance, at
least for allelopathic invaders (i) exuding phytotoxins with large and multiple effects
on the native plants and (ii) having a higher rate of seed production. So, the model
demonstrates that these two conditions are sufficient for a successful allelopathic
invasion. The patterns of invasion shown in Figs. 17 and 18 range from circular with
smooth fronts, in a homogeneous native community, to irregular shapes with
rough fronts, in a heterogeneous native community containing resistant plants.
Fig. 16 Evolution in time of native plant populations in successful invasions. The data correspond
to averages over 200 independent samples. (Figure taken from Ref. [44])
498
S. A. Carvalho and M. L. Martins
Furthermore, adjacent to the invasion front, a rim of empty sites is established, as
seen in Figs. 17 and 18. So, the invasion progresses by suppressing the native plants
nearby its expanding border.
This model demonstrates that seed production and dispersal distance, both traits
associated with the invader species, as well as the native susceptibility to the alien
phytotoxin determine the success probability and the speed of invasion. A greater
seed production by the alien species is necessary, and a higher native sensitivity to its
phytotoxin enhances the invasion success. Indeed, the chance of the invader plant to
colonize new sites increases due to a larger alien seed bank present at this site
coupled with a decreased germination probability of the local native seeds. Also, the
greater death rate of the native juveniles affected by the invader phytotoxin further
enhances the displacement of the native plants. However, a long-range dispersal of
the invasive seeds has an opposite effect, since their seed banks nearby the already
invaded area decrease. But it is just on the edge of the invaded region, where
a greater phytotoxin concentration strongly impairs native seed germination and
seedling establishment, that the colonization opportunities occur.
In addition, invasion occurs even in natural communities without disturbance, at
least for allelopathic invaders (i) exuding phytotoxins with large and multiple effects
on the native plants and (ii) having a higher rate of seed production. So, the model
demonstrates that these two conditions are sufficient for a successful allelopathic
invasion. The patterns of invasion shown in Figs. 17 and 18 range from circular with
smooth fronts, in a homogeneous native community, to irregular shapes with
rough fronts, in a heterogeneous native community containing resistant plants.
Fig. 16 Evolution in time of native plant populations in successful invasions. The data correspond
to averages over 200 independent samples. (Figure taken from Ref. [44])
498
S. A. Carvalho and M. L. Martins