

Typical evolutions in time of native plant populations in successful invasions are
shown in Fig. 16. The fastest decrease of this population occurs when the native
community is homogeneous and constituted entirely of plants with a low resistance
to the alien phytotoxin. The slowest decay of the native population occurs in
heterogeneous communities with resistant plants distributed at patches in the habitat.
In Fig. 17 are shown spatial patterns of invasion at different time steps
corresponding to a homogeneous native plant community with low resistance to
the phytotoxin secreted by the alien species. These invasion patterns are circular
with gyration radii that scale as the square root of the numbers of invader plants N inv
and smooth surfaces (Hurst exponent H = 1) at the asymptotic limit. In turn,
the morphology of the invasion patterns changes if a fraction of the native community exhibits a high resistance to the phytotoxin. Typical invasion patterns for
resistant plants initially distributed in patches on the native habitat are shown in
Fig. 18. It can be noticed that the invasion patterns lost the radial symmetry, yet their
gyration radii scale again as N
1=2
inv . However, the border of the invaded region is rough
and characterized by a Hurst exponent H < 0.5. In addition, spatial patterns of
resistant plants also change with time, exhibiting large patches nearby the invasion
front and an exponential decay of their cluster size distributions (see reference [44]).
In all the simulations, the gyration radius of the invasion pattern increased linearly
in time, and thus the invasion speed is constant. The speed of invasion is
0
0
0
0
0
5
1 0
1 5
0.2
0.4
0.6
0.8
1
0.05
0.1
0.15
0.2
0.05
0.1
0.15
0.2
0.25
0.05
0.1
0.15
0.2
0.15
0.2
0.25
0.3
1
1.5
2
2.5
0.3
0.4
0.5
Invasion Probability
Invasion Probability
Invasion Probability
Invasion Probability
(a)
(b)
(c)
(d)
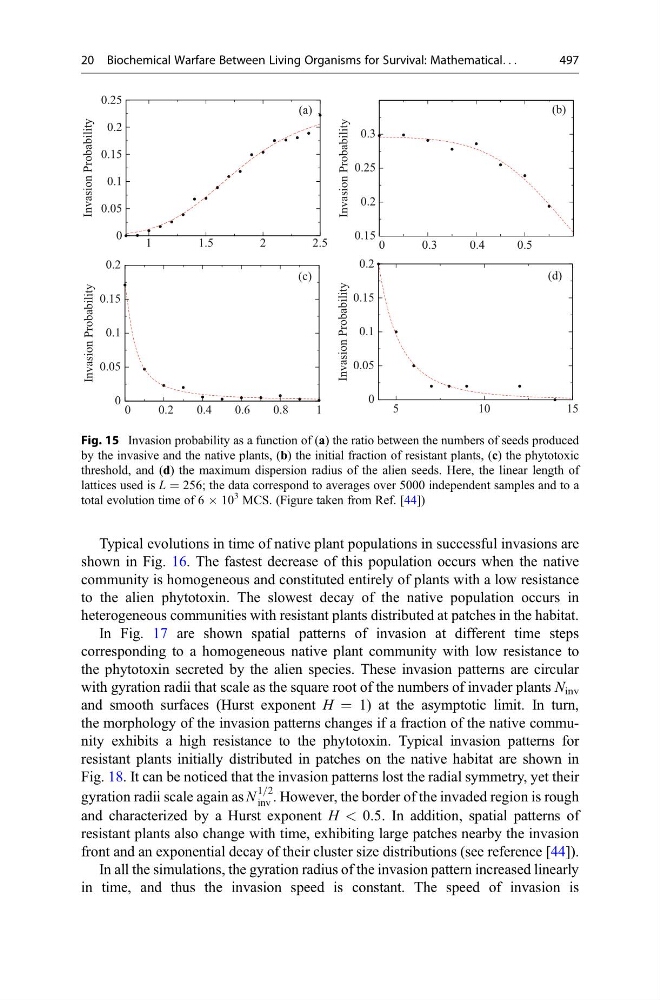
Fig. 15 Invasion probability as a function of (a) the ratio between the numbers of seeds produced
by the invasive and the native plants, (b) the initial fraction of resistant plants, (c) the phytotoxic
threshold, and (d) the maximum dispersion radius of the alien seeds. Here, the linear length of
lattices used is L = 256; the data correspond to averages over 5000 independent samples and to a
total evolution time of 6 Â 10
3 MCS. (Figure taken from Ref. [44])
20 Biochemical Warfare Between Living Organisms for Survival: Mathematical. . .
497
shown in Fig. 16. The fastest decrease of this population occurs when the native
community is homogeneous and constituted entirely of plants with a low resistance
to the alien phytotoxin. The slowest decay of the native population occurs in
heterogeneous communities with resistant plants distributed at patches in the habitat.
In Fig. 17 are shown spatial patterns of invasion at different time steps
corresponding to a homogeneous native plant community with low resistance to
the phytotoxin secreted by the alien species. These invasion patterns are circular
with gyration radii that scale as the square root of the numbers of invader plants N inv
and smooth surfaces (Hurst exponent H = 1) at the asymptotic limit. In turn,
the morphology of the invasion patterns changes if a fraction of the native community exhibits a high resistance to the phytotoxin. Typical invasion patterns for
resistant plants initially distributed in patches on the native habitat are shown in
Fig. 18. It can be noticed that the invasion patterns lost the radial symmetry, yet their
gyration radii scale again as N
1=2
inv . However, the border of the invaded region is rough
and characterized by a Hurst exponent H < 0.5. In addition, spatial patterns of
resistant plants also change with time, exhibiting large patches nearby the invasion
front and an exponential decay of their cluster size distributions (see reference [44]).
In all the simulations, the gyration radius of the invasion pattern increased linearly
in time, and thus the invasion speed is constant. The speed of invasion is
0
0
0
0
0
5
1 0
1 5
0.2
0.4
0.6
0.8
1
0.05
0.1
0.15
0.2
0.05
0.1
0.15
0.2
0.25
0.05
0.1
0.15
0.2
0.15
0.2
0.25
0.3
1
1.5
2
2.5
0.3
0.4
0.5
Invasion Probability
Invasion Probability
Invasion Probability
Invasion Probability
(a)
(b)
(c)
(d)
Fig. 15 Invasion probability as a function of (a) the ratio between the numbers of seeds produced
by the invasive and the native plants, (b) the initial fraction of resistant plants, (c) the phytotoxic
threshold, and (d) the maximum dispersion radius of the alien seeds. Here, the linear length of
lattices used is L = 256; the data correspond to averages over 5000 independent samples and to a
total evolution time of 6 Â 10
3 MCS. (Figure taken from Ref. [44])
20 Biochemical Warfare Between Living Organisms for Survival: Mathematical. . .
497