

where n
i
jk ¼ 1 if the node i lies on the path of minimal length from node j to node k
and n
i
jk ¼ 0 if i does not or if there is no such path. In Fig. 14, the average hx i i is
plotted for every node i present at the stationary allelochemical network after l = 100
SIE. It can be noticed that hx i i decreases dramatically as the strength of allelopathic
suppression increases. Indeed, even at weak suppression (μ = 0.1), strong responses
to toxins (Φ
(3) lead to small average hx i i. Furthermore, despite small fluctuations, the
average centrality is practically a constant function indicating a uniform connectivity
pattern for every node and the absence of hubs, bridges joining distinct modules, and
star graphs in the network.
All these results must be analyzed bearing in mind the scenario for pure intra- and
interspecific competition. As the models reported here assume, in the coexistence
regime (weak competition, ν ij < 1 8 i, j), all the surviving species at every
stationary state constitute fully connected networks. Since some introduced and/ or
resident species are eventually extinct, the community diversity tends to be smaller
than the number of invasion or speciation events. Yet, communities with high
diversity are the rule. This scenario changes if allelopathic interactions exist.
In the SIE dynamics, ecological networks grow through a succession of species
immigration. These alien species allelochemically suppress and are suppressed by
resident species at random, eventually leading to the eradication of either the invader
or some resident species. Our results, shown in Fig. 10, reveal that communities
exhibiting large diversities can be assembled at weak allelopathy, but diversities are
0
2 0
4 0
6 0
8 0
1 0 0
0
0.1
0.2
0.3
20 30 40 50 60 70 80 90 100
0
0.02
0.04
0.06
0.08
10
20
30
40
0
0.1
0.2
0.3
0.4
0
20
40
60
80
100
0
0.03
0.06
0.09
0.12
32
64
10
-3
10
-2
10
-1
1
2
4
8
10
-4
10
-3
10
-2
10
-1
10
100
10
-3
10
-2
10
-1
8 16 32 64
10
-3
10
-2
10
-1
in
in
k
P(k )
Φ
Φ
Φ
Φ
Φ
Φ
(1)
(2)
(3)
(4)
(5)
(6)
Φ
(1)
Φ
(3)
Φ
(5)
μ=0.1
μ=0.5
μ=0.1
μ=0.5
Φ
Φ
Φ
(2)
(4)
(6)
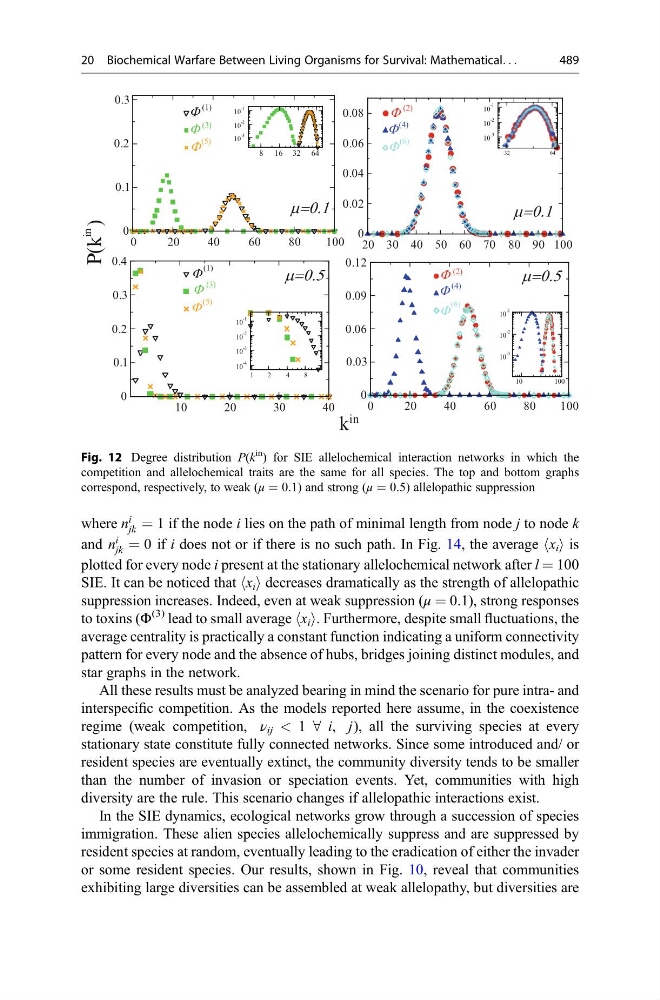
Fig. 12 Degree distribution P(k
in ) for SIE allelochemical interaction networks in which the
competition and allelochemical traits are the same for all species. The top and bottom graphs
correspond, respectively, to weak (μ = 0.1) and strong (μ = 0.5) allelopathic suppression
20 Biochemical Warfare Between Living Organisms for Survival: Mathematical. . .
489
i
jk ¼ 1 if the node i lies on the path of minimal length from node j to node k
and n
i
jk ¼ 0 if i does not or if there is no such path. In Fig. 14, the average hx i i is
plotted for every node i present at the stationary allelochemical network after l = 100
SIE. It can be noticed that hx i i decreases dramatically as the strength of allelopathic
suppression increases. Indeed, even at weak suppression (μ = 0.1), strong responses
to toxins (Φ
(3) lead to small average hx i i. Furthermore, despite small fluctuations, the
average centrality is practically a constant function indicating a uniform connectivity
pattern for every node and the absence of hubs, bridges joining distinct modules, and
star graphs in the network.
All these results must be analyzed bearing in mind the scenario for pure intra- and
interspecific competition. As the models reported here assume, in the coexistence
regime (weak competition, ν ij < 1 8 i, j), all the surviving species at every
stationary state constitute fully connected networks. Since some introduced and/ or
resident species are eventually extinct, the community diversity tends to be smaller
than the number of invasion or speciation events. Yet, communities with high
diversity are the rule. This scenario changes if allelopathic interactions exist.
In the SIE dynamics, ecological networks grow through a succession of species
immigration. These alien species allelochemically suppress and are suppressed by
resident species at random, eventually leading to the eradication of either the invader
or some resident species. Our results, shown in Fig. 10, reveal that communities
exhibiting large diversities can be assembled at weak allelopathy, but diversities are
0
2 0
4 0
6 0
8 0
1 0 0
0
0.1
0.2
0.3
20 30 40 50 60 70 80 90 100
0
0.02
0.04
0.06
0.08
10
20
30
40
0
0.1
0.2
0.3
0.4
0
20
40
60
80
100
0
0.03
0.06
0.09
0.12
32
64
10
-3
10
-2
10
-1
1
2
4
8
10
-4
10
-3
10
-2
10
-1
10
100
10
-3
10
-2
10
-1
8 16 32 64
10
-3
10
-2
10
-1
in
in
k
P(k )
Φ
Φ
Φ
Φ
Φ
Φ
(1)
(2)
(3)
(4)
(5)
(6)
Φ
(1)
Φ
(3)
Φ
(5)
μ=0.1
μ=0.5
μ=0.1
μ=0.5
Φ
Φ
Φ
(2)
(4)
(6)
Fig. 12 Degree distribution P(k
in ) for SIE allelochemical interaction networks in which the
competition and allelochemical traits are the same for all species. The top and bottom graphs
correspond, respectively, to weak (μ = 0.1) and strong (μ = 0.5) allelopathic suppression
20 Biochemical Warfare Between Living Organisms for Survival: Mathematical. . .
489