

by skewness S $ O and kurtosis K $ 3 (see reference [35]). However, the ratio
κ = hk
2
i/hki $ hki is always obtained, indicating that the SIE allelochemical
networks are homogeneous [37]. In turn, the degree distributions P(k
out ) for all
scenarios are normal (Gaussian) distributions (data not shown).
Typical allelochemical networks or community structures generated by the SIE
dynamics are illustrated in Fig. 13. The nodes in these networks represent species
present in the community, and the directed edges between them represent allelopathic interactions. The general rule is that as the allelopathic strength increases, the
number of node (surviving species) decreases, but the network topology sustain a
highly uniform connectivity pattern for every node. The combined effect of heterogeneous competition and allelopathy dramatically decreases the network size, as
shown in Fig. 13c and d.
Lastly, the betweenness centrality measures the extent to which a node lies
on paths of minimal length connecting to other nodes [37]. Nodes with high
betweenness centrality often have significant influence on the network dynamics.
Mathematically, the betweenness centrality x i of a node i is defined as
x i ¼
X
j,k
n
i
jk ,
(7)
0
20
40
60
80
100
0.47
0.48
0.49
0.5
0.51
0.52
0
20
40
60
80
100
0.46
0.48
0.5
0.52
0.54
0
5
10
15
20
25
30
0.4
0.45
0.5
0.55
0.6
0
20
40
60
80
100
0.46
0.48
0.5
0.52
0.54
μ=0.1
μ=0.1
μ=0.5
μ=0.5
C(n)
n
Φ
Φ
Φ
Φ
Φ
Φ
Φ
Φ
Φ
Φ
Φ
Φ
(1)
(1)
(3)
(3)
(5)
(5)
(2)
(2)
(4)
(4)
(6)
(6)
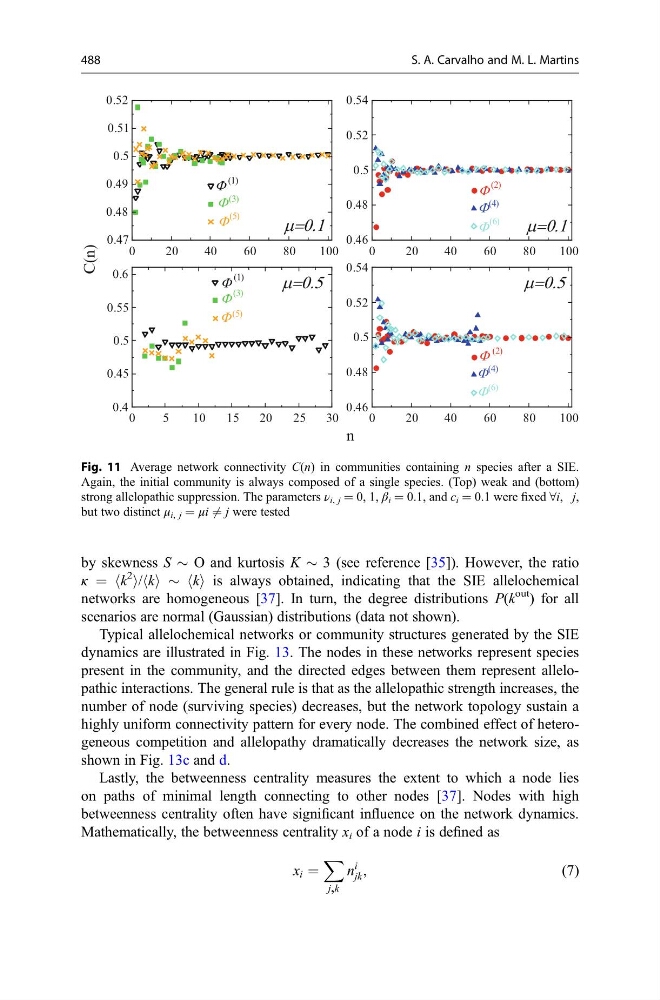
Fig. 11 Average network connectivity C(n) in communities containing n species after a SIE.
Again, the initial community is always composed of a single species. (Top) weak and (bottom)
strong allelopathic suppression. The parameters ν i, j = 0, 1, β i = 0.1, and c i = 0.1 were fixed 8i, j,
but two distinct μ i, j = μi 6 ¼ j were tested
488
S. A. Carvalho and M. L. Martins
κ = hk
2
i/hki $ hki is always obtained, indicating that the SIE allelochemical
networks are homogeneous [37]. In turn, the degree distributions P(k
out ) for all
scenarios are normal (Gaussian) distributions (data not shown).
Typical allelochemical networks or community structures generated by the SIE
dynamics are illustrated in Fig. 13. The nodes in these networks represent species
present in the community, and the directed edges between them represent allelopathic interactions. The general rule is that as the allelopathic strength increases, the
number of node (surviving species) decreases, but the network topology sustain a
highly uniform connectivity pattern for every node. The combined effect of heterogeneous competition and allelopathy dramatically decreases the network size, as
shown in Fig. 13c and d.
Lastly, the betweenness centrality measures the extent to which a node lies
on paths of minimal length connecting to other nodes [37]. Nodes with high
betweenness centrality often have significant influence on the network dynamics.
Mathematically, the betweenness centrality x i of a node i is defined as
x i ¼
X
j,k
n
i
jk ,
(7)
0
20
40
60
80
100
0.47
0.48
0.49
0.5
0.51
0.52
0
20
40
60
80
100
0.46
0.48
0.5
0.52
0.54
0
5
10
15
20
25
30
0.4
0.45
0.5
0.55
0.6
0
20
40
60
80
100
0.46
0.48
0.5
0.52
0.54
μ=0.1
μ=0.1
μ=0.5
μ=0.5
C(n)
n
Φ
Φ
Φ
Φ
Φ
Φ
Φ
Φ
Φ
Φ
Φ
Φ
(1)
(1)
(3)
(3)
(5)
(5)
(2)
(2)
(4)
(4)
(6)
(6)
Fig. 11 Average network connectivity C(n) in communities containing n species after a SIE.
Again, the initial community is always composed of a single species. (Top) weak and (bottom)
strong allelopathic suppression. The parameters ν i, j = 0, 1, β i = 0.1, and c i = 0.1 were fixed 8i, j,
but two distinct μ i, j = μi 6 ¼ j were tested
488
S. A. Carvalho and M. L. Martins