

19 The Effects of Plant Irrigation in Poland
385
y = -0.0388x + 10.19
R² = 0.8523
0
1
2
3
4
5
6
7
8
9
10
0
50
100
150
200
250
300
Yield increase (t·ha -1
)
Atmospheric precipitation (mm)
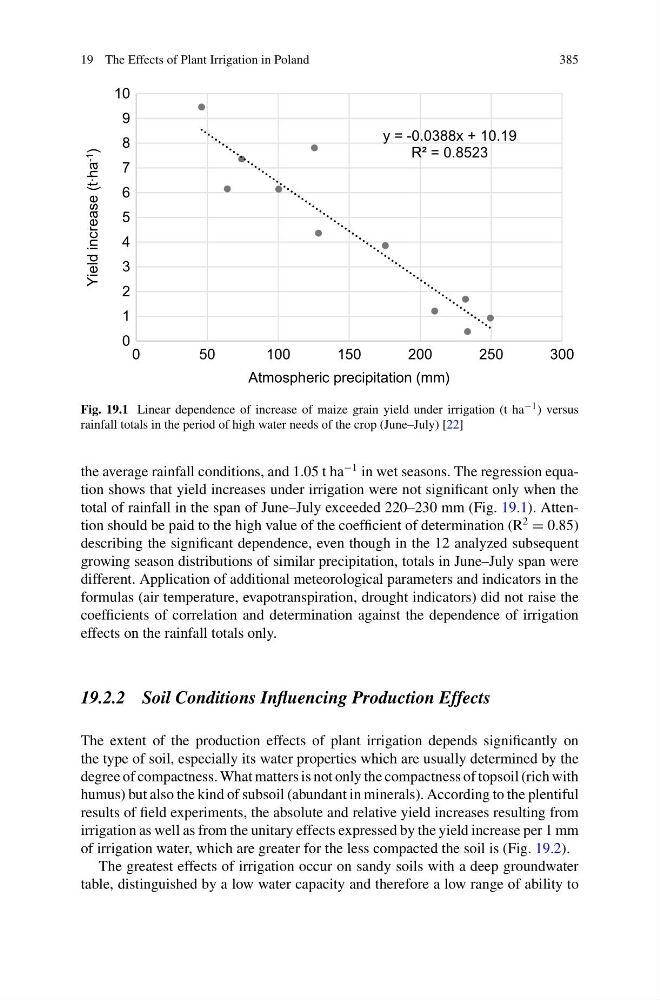
Fig. 19.1 Linear dependence of increase of maize grain yield under irrigation (t ha −1 ) versus
rainfall totals in the period of high water needs of the crop (June–July) [22]
the average rainfall conditions, and 1.05 t ha
−1 in wet seasons. The regression equation shows that yield increases under irrigation were not significant only when the
total of rainfall in the span of June–July exceeded 220–230 mm (Fig. 19.1). Attention should be paid to the high value of the coefficient of determination (R
2
= 0.85)
describing the significant dependence, even though in the 12 analyzed subsequent
growing season distributions of similar precipitation, totals in June–July span were
different. Application of additional meteorological parameters and indicators in the
formulas (air temperature, evapotranspiration, drought indicators) did not raise the
coefficients of correlation and determination against the dependence of irrigation
effects on the rainfall totals only.
19.2.2 Soil Conditions Influencing Production Effects
The extent of the production effects of plant irrigation depends significantly on
the type of soil, especially its water properties which are usually determined by the
degree of compactness. What matters is not only the compactness of topsoil (rich with
humus) but also the kind of subsoil (abundant in minerals). According to the plentiful
results of field experiments, the absolute and relative yield increases resulting from
irrigation as well as from the unitary effects expressed by the yield increase per 1 mm
of irrigation water, which are greater for the less compacted the soil is (Fig. 19.2).
The greatest effects of irrigation occur on sandy soils with a deep groundwater
table, distinguished by a low water capacity and therefore a low range of ability to
385
y = -0.0388x + 10.19
R² = 0.8523
0
1
2
3
4
5
6
7
8
9
10
0
50
100
150
200
250
300
Yield increase (t·ha -1
)
Atmospheric precipitation (mm)
Fig. 19.1 Linear dependence of increase of maize grain yield under irrigation (t ha −1 ) versus
rainfall totals in the period of high water needs of the crop (June–July) [22]
the average rainfall conditions, and 1.05 t ha
−1 in wet seasons. The regression equation shows that yield increases under irrigation were not significant only when the
total of rainfall in the span of June–July exceeded 220–230 mm (Fig. 19.1). Attention should be paid to the high value of the coefficient of determination (R
2
= 0.85)
describing the significant dependence, even though in the 12 analyzed subsequent
growing season distributions of similar precipitation, totals in June–July span were
different. Application of additional meteorological parameters and indicators in the
formulas (air temperature, evapotranspiration, drought indicators) did not raise the
coefficients of correlation and determination against the dependence of irrigation
effects on the rainfall totals only.
19.2.2 Soil Conditions Influencing Production Effects
The extent of the production effects of plant irrigation depends significantly on
the type of soil, especially its water properties which are usually determined by the
degree of compactness. What matters is not only the compactness of topsoil (rich with
humus) but also the kind of subsoil (abundant in minerals). According to the plentiful
results of field experiments, the absolute and relative yield increases resulting from
irrigation as well as from the unitary effects expressed by the yield increase per 1 mm
of irrigation water, which are greater for the less compacted the soil is (Fig. 19.2).
The greatest effects of irrigation occur on sandy soils with a deep groundwater
table, distinguished by a low water capacity and therefore a low range of ability to