

384
R. Ku´ smierek-Tomaszewska and J. ˙
Zarski
Q = (P OPT − P A )k
(19.1)
where:
Q
expected yield increase under the influence of irrigation (kg ha
1 ),
K
yield increase per 1 mm of rainfall deficit supplemented by irrigation (kg ha
1 ),
P OPT the total of optimal rainfall, i.e., this where no increases in yield due to
irrigation are observed (mm),
P A
the total of actual rainfall in the period of the highest need for water of a given
species (mm).
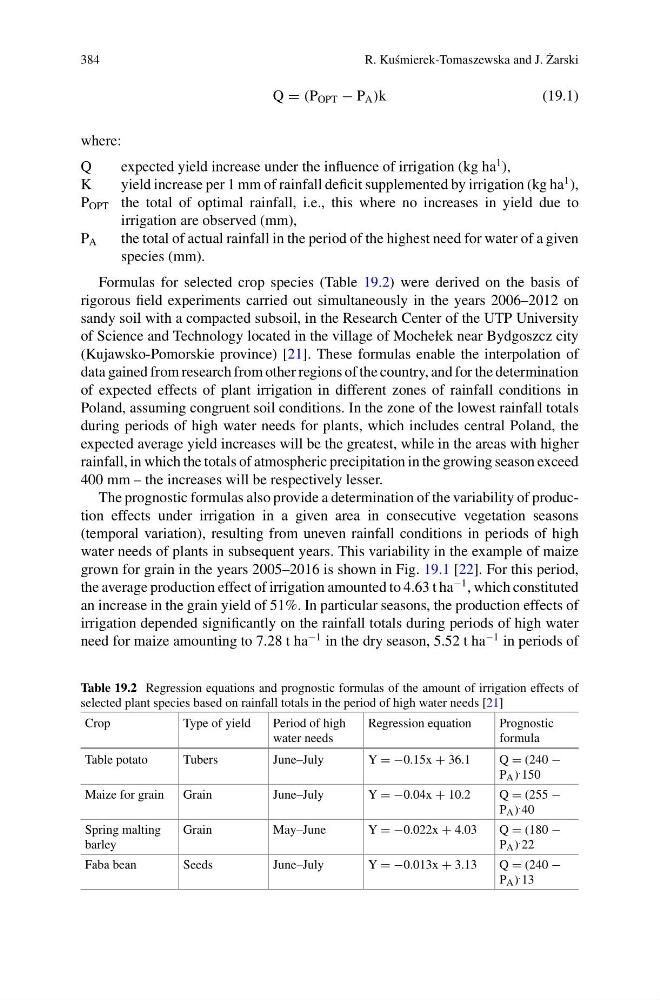
Formulas for selected crop species (Table 19.2) were derived on the basis of
rigorous field experiments carried out simultaneously in the years 2006–2012 on
sandy soil with a compacted subsoil, in the Research Center of the UTP University
of Science and Technology located in the village of Mochełek near Bydgoszcz city
(Kujawsko-Pomorskie province) [21]. These formulas enable the interpolation of
data gained from research from other regions of the country, and for the determination
of expected effects of plant irrigation in different zones of rainfall conditions in
Poland, assuming congruent soil conditions. In the zone of the lowest rainfall totals
during periods of high water needs for plants, which includes central Poland, the
expected average yield increases will be the greatest, while in the areas with higher
rainfall, in which the totals of atmospheric precipitation in the growing season exceed
400 mm – the increases will be respectively lesser.
The prognostic formulas also provide a determination of the variability of production effects under irrigation in a given area in consecutive vegetation seasons
(temporal variation), resulting from uneven rainfall conditions in periods of high
water needs of plants in subsequent years. This variability in the example of maize
grown for grain in the years 2005–2016 is shown in Fig. 19.1 [22]. For this period,
the average production effect of irrigation amounted to 4.63 t ha
−1 , which constituted
an increase in the grain yield of 51%. In particular seasons, the production effects of
irrigation depended significantly on the rainfall totals during periods of high water
need for maize amounting to 7.28 t ha
−1 in the dry season, 5.52 t ha
−1 in periods of
Table 19.2 Regression equations and prognostic formulas of the amount of irrigation effects of
selected plant species based on rainfall totals in the period of high water needs [21]
Crop
Type of yield
Period of high
water needs
Regression equation
Prognostic
formula
Table potato
Tubers
June–July
Y = −0.15x + 36.1
Q = (240 −
P A ) . 150
Maize for grain
Grain
June–July
Y = −0.04x + 10.2
Q = (255 −
P A ) . 40
Spring malting
barley
Grain
May–June
Y = −0.022x + 4.03
Q = (180 −
P A ) . 22
Faba bean
Seeds
June–July
Y = −0.013x + 3.13
Q = (240 −
P A ) . 13
R. Ku´ smierek-Tomaszewska and J. ˙
Zarski
Q = (P OPT − P A )k
(19.1)
where:
Q
expected yield increase under the influence of irrigation (kg ha
1 ),
K
yield increase per 1 mm of rainfall deficit supplemented by irrigation (kg ha
1 ),
P OPT the total of optimal rainfall, i.e., this where no increases in yield due to
irrigation are observed (mm),
P A
the total of actual rainfall in the period of the highest need for water of a given
species (mm).
Formulas for selected crop species (Table 19.2) were derived on the basis of
rigorous field experiments carried out simultaneously in the years 2006–2012 on
sandy soil with a compacted subsoil, in the Research Center of the UTP University
of Science and Technology located in the village of Mochełek near Bydgoszcz city
(Kujawsko-Pomorskie province) [21]. These formulas enable the interpolation of
data gained from research from other regions of the country, and for the determination
of expected effects of plant irrigation in different zones of rainfall conditions in
Poland, assuming congruent soil conditions. In the zone of the lowest rainfall totals
during periods of high water needs for plants, which includes central Poland, the
expected average yield increases will be the greatest, while in the areas with higher
rainfall, in which the totals of atmospheric precipitation in the growing season exceed
400 mm – the increases will be respectively lesser.
The prognostic formulas also provide a determination of the variability of production effects under irrigation in a given area in consecutive vegetation seasons
(temporal variation), resulting from uneven rainfall conditions in periods of high
water needs of plants in subsequent years. This variability in the example of maize
grown for grain in the years 2005–2016 is shown in Fig. 19.1 [22]. For this period,
the average production effect of irrigation amounted to 4.63 t ha
−1 , which constituted
an increase in the grain yield of 51%. In particular seasons, the production effects of
irrigation depended significantly on the rainfall totals during periods of high water
need for maize amounting to 7.28 t ha
−1 in the dry season, 5.52 t ha
−1 in periods of
Table 19.2 Regression equations and prognostic formulas of the amount of irrigation effects of
selected plant species based on rainfall totals in the period of high water needs [21]
Crop
Type of yield
Period of high
water needs
Regression equation
Prognostic
formula
Table potato
Tubers
June–July
Y = −0.15x + 36.1
Q = (240 −
P A ) . 150
Maize for grain
Grain
June–July
Y = −0.04x + 10.2
Q = (255 −
P A ) . 40
Spring malting
barley
Grain
May–June
Y = −0.022x + 4.03
Q = (180 −
P A ) . 22
Faba bean
Seeds
June–July
Y = −0.013x + 3.13
Q = (240 −
P A ) . 13