

316
J. Fac-Beneda et al.
irreversible removal from the river system. Nitrogen retention and loss occur mainly
in the source sections (denitrification), and the phosphorus – in the downstream
part (sedimentation). Undoubtedly, however, land use in the catchment and the size
and location of the point, linear and area pollution sources are responsible for the
pollution volume.
The quality of river waters leaves much to be desired. In 2016 the ecological
potential of only the Pars˛ eta and Słupia was assessed as good. The remaining rivers
had the potential rather moderate (the Reda and Wieprza) or poor (the Łupawa, Łeba,
and Rega) [29, 34]. The situation in jcwp (the WFD surface water body) was worse.
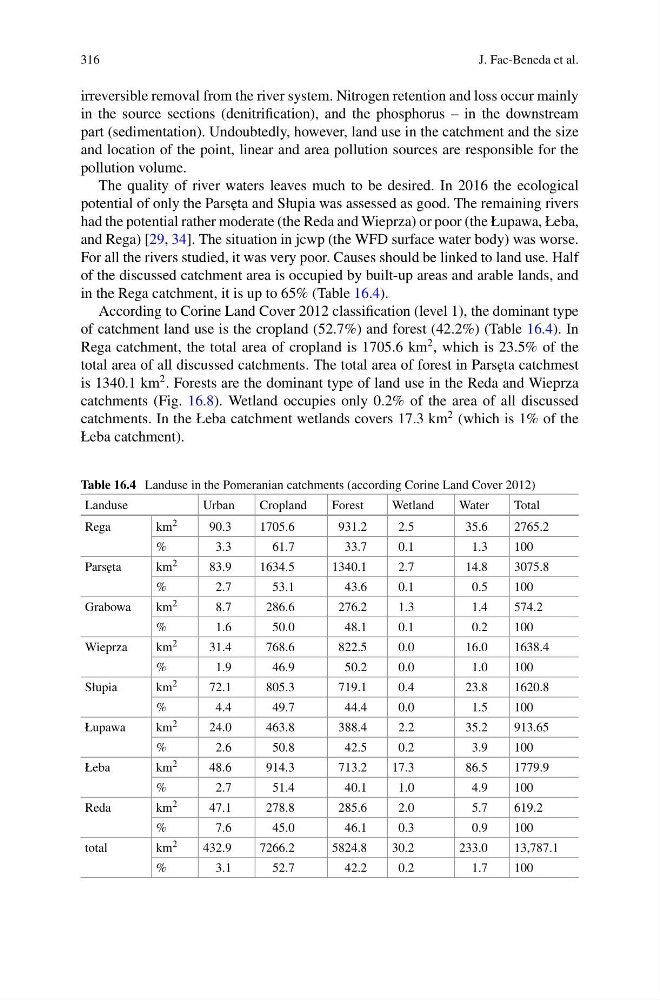
For all the rivers studied, it was very poor. Causes should be linked to land use. Half
of the discussed catchment area is occupied by built-up areas and arable lands, and
in the Rega catchment, it is up to 65% (Table 16.4).
According to Corine Land Cover 2012 classification (level 1), the dominant type
of catchment land use is the cropland (52.7%) and forest (42.2%) (Table 16.4). In
Rega catchment, the total area of cropland is 1705.6 km
2 , which is 23.5% of the
total area of all discussed catchments. The total area of forest in Pars˛ eta catchmest
is 1340.1 km
2 . Forests are the dominant type of land use in the Reda and Wieprza
catchments (Fig. 16.8). Wetland occupies only 0.2% of the area of all discussed
catchments. In the Łeba catchment wetlands covers 17.3 km
2 (which is 1% of the
Łeba catchment).
Table 16.4 Landuse in the Pomeranian catchments (according Corine Land Cover 2012)
Landuse
Urban
Cropland
Forest
Wetland
Water
Total
Rega
km 2
90.3
1705.6
931.2
2.5
35.6
2765.2
%
3.3
61.7
33.7
0.1
1.3
100
Pars˛ eta
km 2
83.9
1634.5
1340.1
2.7
14.8
3075.8
%
2.7
53.1
43.6
0.1
0.5
100
Grabowa
km 2
8.7
286.6
276.2
1.3
1.4
574.2
%
1.6
50.0
48.1
0.1
0.2
100
Wieprza
km 2
31.4
768.6
822.5
0.0
16.0
1638.4
%
1.9
46.9
50.2
0.0
1.0
100
Słupia
km 2
72.1
805.3
719.1
0.4
23.8
1620.8
%
4.4
49.7
44.4
0.0
1.5
100
Łupawa
km 2
24.0
463.8
388.4
2.2
35.2
913.65
%
2.6
50.8
42.5
0.2
3.9
100
Łeba
km 2
48.6
914.3
713.2
17.3
86.5
1779.9
%
2.7
51.4
40.1
1.0
4.9
100
Reda
km 2
47.1
278.8
285.6
2.0
5.7
619.2
%
7.6
45.0
46.1
0.3
0.9
100
total
km 2
432.9
7266.2
5824.8
30.2
233.0
13,787.1
%
3.1
52.7
42.2
0.2
1.7
100
J. Fac-Beneda et al.
irreversible removal from the river system. Nitrogen retention and loss occur mainly
in the source sections (denitrification), and the phosphorus – in the downstream
part (sedimentation). Undoubtedly, however, land use in the catchment and the size
and location of the point, linear and area pollution sources are responsible for the
pollution volume.
The quality of river waters leaves much to be desired. In 2016 the ecological
potential of only the Pars˛ eta and Słupia was assessed as good. The remaining rivers
had the potential rather moderate (the Reda and Wieprza) or poor (the Łupawa, Łeba,
and Rega) [29, 34]. The situation in jcwp (the WFD surface water body) was worse.
For all the rivers studied, it was very poor. Causes should be linked to land use. Half
of the discussed catchment area is occupied by built-up areas and arable lands, and
in the Rega catchment, it is up to 65% (Table 16.4).
According to Corine Land Cover 2012 classification (level 1), the dominant type
of catchment land use is the cropland (52.7%) and forest (42.2%) (Table 16.4). In
Rega catchment, the total area of cropland is 1705.6 km
2 , which is 23.5% of the
total area of all discussed catchments. The total area of forest in Pars˛ eta catchmest
is 1340.1 km
2 . Forests are the dominant type of land use in the Reda and Wieprza
catchments (Fig. 16.8). Wetland occupies only 0.2% of the area of all discussed
catchments. In the Łeba catchment wetlands covers 17.3 km
2 (which is 1% of the
Łeba catchment).
Table 16.4 Landuse in the Pomeranian catchments (according Corine Land Cover 2012)
Landuse
Urban
Cropland
Forest
Wetland
Water
Total
Rega
km 2
90.3
1705.6
931.2
2.5
35.6
2765.2
%
3.3
61.7
33.7
0.1
1.3
100
Pars˛ eta
km 2
83.9
1634.5
1340.1
2.7
14.8
3075.8
%
2.7
53.1
43.6
0.1
0.5
100
Grabowa
km 2
8.7
286.6
276.2
1.3
1.4
574.2
%
1.6
50.0
48.1
0.1
0.2
100
Wieprza
km 2
31.4
768.6
822.5
0.0
16.0
1638.4
%
1.9
46.9
50.2
0.0
1.0
100
Słupia
km 2
72.1
805.3
719.1
0.4
23.8
1620.8
%
4.4
49.7
44.4
0.0
1.5
100
Łupawa
km 2
24.0
463.8
388.4
2.2
35.2
913.65
%
2.6
50.8
42.5
0.2
3.9
100
Łeba
km 2
48.6
914.3
713.2
17.3
86.5
1779.9
%
2.7
51.4
40.1
1.0
4.9
100
Reda
km 2
47.1
278.8
285.6
2.0
5.7
619.2
%
7.6
45.0
46.1
0.3
0.9
100
total
km 2
432.9
7266.2
5824.8
30.2
233.0
13,787.1
%
3.1
52.7
42.2
0.2
1.7
100