

14 Flood Potential of Polish Rivers
277
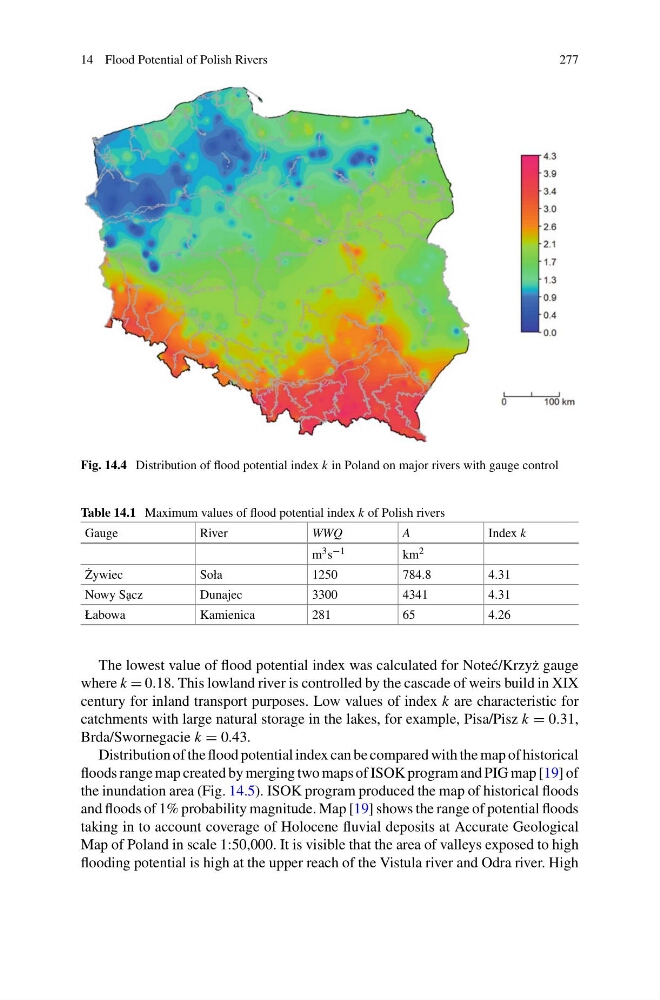
Fig. 14.4 Distribution of flood potential index k in Poland on major rivers with gauge control
Table 14.1 Maximum values of flood potential index k of Polish rivers
Gauge
River
WWQ
A
Index k
m 3 s −1
km 2
˙
Zywiec
Soła
1250
784.8
4.31
Nowy S˛ acz
Dunajec
3300
4341
4.31
Łabowa
Kamienica
281
65
4.26
The lowest value of flood potential index was calculated for Note´ c/Krzy˙ z gauge
where k = 0.18. This lowland river is controlled by the cascade of weirs build in XIX
century for inland transport purposes. Low values of index k are characteristic for
catchments with large natural storage in the lakes, for example, Pisa/Pisz k = 0.31,
Brda/Swornegacie k = 0.43.
Distribution of the flood potential index can be compared with the map of historical
floods range map created by merging two maps of ISOK program and PIG map [19] of
the inundation area (Fig. 14.5). ISOK program produced the map of historical floods
and floods of 1% probability magnitude. Map [19] shows the range of potential floods
taking in to account coverage of Holocene fluvial deposits at Accurate Geological
Map of Poland in scale 1:50,000. It is visible that the area of valleys exposed to high
flooding potential is high at the upper reach of the Vistula river and Odra river. High
277
Fig. 14.4 Distribution of flood potential index k in Poland on major rivers with gauge control
Table 14.1 Maximum values of flood potential index k of Polish rivers
Gauge
River
WWQ
A
Index k
m 3 s −1
km 2
˙
Zywiec
Soła
1250
784.8
4.31
Nowy S˛ acz
Dunajec
3300
4341
4.31
Łabowa
Kamienica
281
65
4.26
The lowest value of flood potential index was calculated for Note´ c/Krzy˙ z gauge
where k = 0.18. This lowland river is controlled by the cascade of weirs build in XIX
century for inland transport purposes. Low values of index k are characteristic for
catchments with large natural storage in the lakes, for example, Pisa/Pisz k = 0.31,
Brda/Swornegacie k = 0.43.
Distribution of the flood potential index can be compared with the map of historical
floods range map created by merging two maps of ISOK program and PIG map [19] of
the inundation area (Fig. 14.5). ISOK program produced the map of historical floods
and floods of 1% probability magnitude. Map [19] shows the range of potential floods
taking in to account coverage of Holocene fluvial deposits at Accurate Geological
Map of Poland in scale 1:50,000. It is visible that the area of valleys exposed to high
flooding potential is high at the upper reach of the Vistula river and Odra river. High