

278
A. Magnuszewski
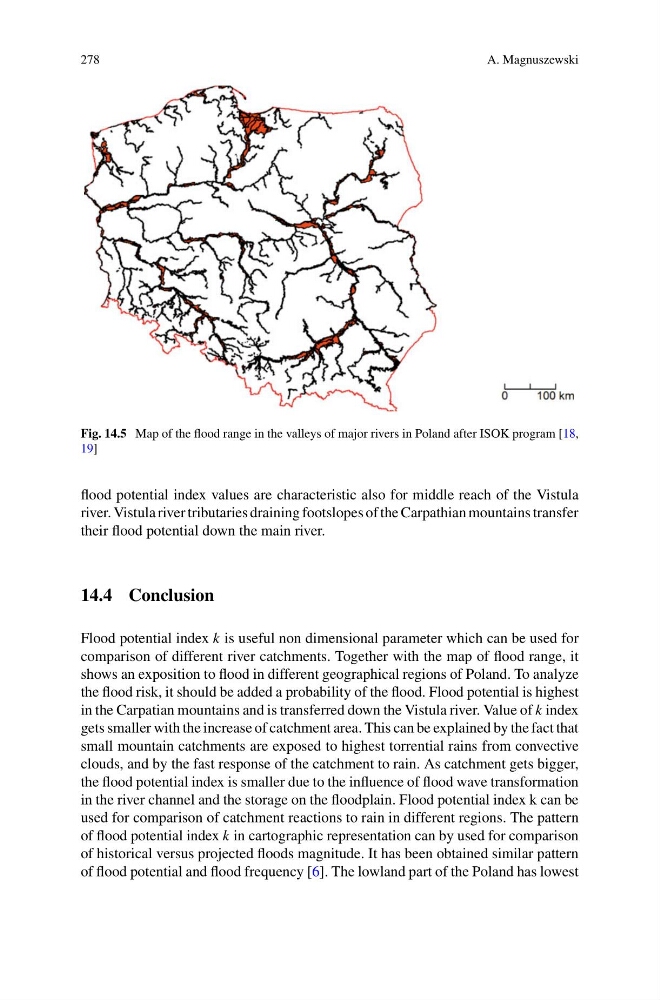
Fig. 14.5 Map of the flood range in the valleys of major rivers in Poland after ISOK program [18,
19]
flood potential index values are characteristic also for middle reach of the Vistula
river. Vistula river tributaries draining footslopes of the Carpathian mountains transfer
their flood potential down the main river.
14.4 Conclusion
Flood potential index k is useful non dimensional parameter which can be used for
comparison of different river catchments. Together with the map of flood range, it
shows an exposition to flood in different geographical regions of Poland. To analyze
the flood risk, it should be added a probability of the flood. Flood potential is highest
in the Carpatian mountains and is transferred down the Vistula river. Value of k index
gets smaller with the increase of catchment area. This can be explained by the fact that
small mountain catchments are exposed to highest torrential rains from convective
clouds, and by the fast response of the catchment to rain. As catchment gets bigger,
the flood potential index is smaller due to the influence of flood wave transformation
in the river channel and the storage on the floodplain. Flood potential index k can be
used for comparison of catchment reactions to rain in different regions. The pattern
of flood potential index k in cartographic representation can by used for comparison
of historical versus projected floods magnitude. It has been obtained similar pattern
of flood potential and flood frequency [6]. The lowland part of the Poland has lowest
A. Magnuszewski
Fig. 14.5 Map of the flood range in the valleys of major rivers in Poland after ISOK program [18,
19]
flood potential index values are characteristic also for middle reach of the Vistula
river. Vistula river tributaries draining footslopes of the Carpathian mountains transfer
their flood potential down the main river.
14.4 Conclusion
Flood potential index k is useful non dimensional parameter which can be used for
comparison of different river catchments. Together with the map of flood range, it
shows an exposition to flood in different geographical regions of Poland. To analyze
the flood risk, it should be added a probability of the flood. Flood potential is highest
in the Carpatian mountains and is transferred down the Vistula river. Value of k index
gets smaller with the increase of catchment area. This can be explained by the fact that
small mountain catchments are exposed to highest torrential rains from convective
clouds, and by the fast response of the catchment to rain. As catchment gets bigger,
the flood potential index is smaller due to the influence of flood wave transformation
in the river channel and the storage on the floodplain. Flood potential index k can be
used for comparison of catchment reactions to rain in different regions. The pattern
of flood potential index k in cartographic representation can by used for comparison
of historical versus projected floods magnitude. It has been obtained similar pattern
of flood potential and flood frequency [6]. The lowland part of the Poland has lowest