

276
A. Magnuszewski
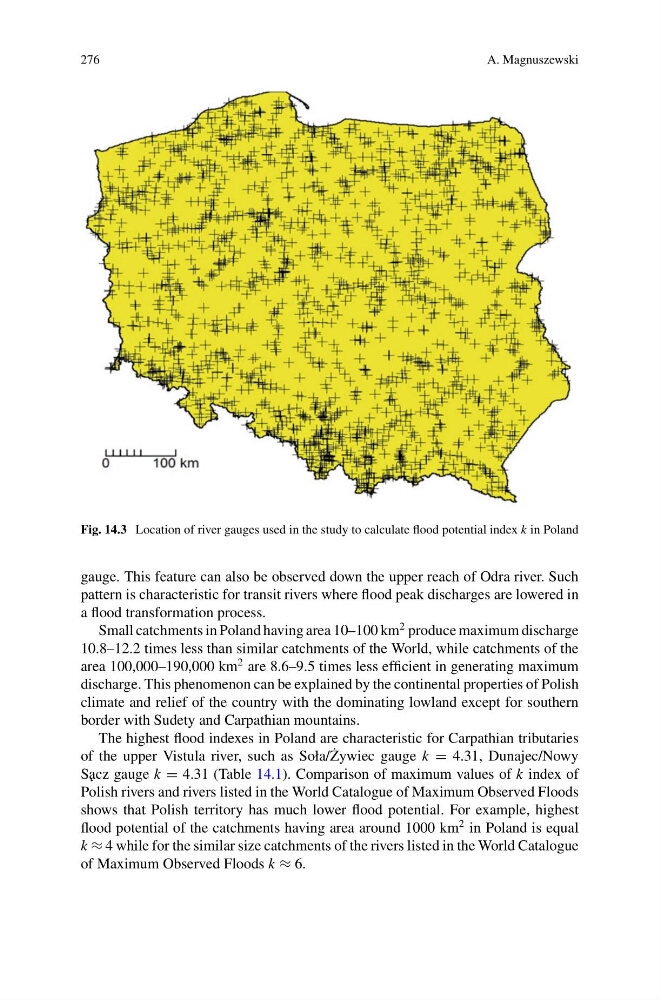
Fig. 14.3 Location of river gauges used in the study to calculate flood potential index k in Poland
gauge. This feature can also be observed down the upper reach of Odra river. Such
pattern is characteristic for transit rivers where flood peak discharges are lowered in
a flood transformation process.
Small catchments in Poland having area 10–100 km
2 produce maximum discharge
10.8–12.2 times less than similar catchments of the World, while catchments of the
area 100,000–190,000 km
2 are 8.6–9.5 times less efficient in generating maximum
discharge. This phenomenon can be explained by the continental properties of Polish
climate and relief of the country with the dominating lowland except for southern
border with Sudety and Carpathian mountains.
The highest flood indexes in Poland are characteristic for Carpathian tributaries
of the upper Vistula river, such as Soła/ ˙
Zywiec gauge k = 4.31, Dunajec/Nowy
S˛ acz gauge k = 4.31 (Table 14.1). Comparison of maximum values of k index of
Polish rivers and rivers listed in the World Catalogue of Maximum Observed Floods
shows that Polish territory has much lower flood potential. For example, highest
flood potential of the catchments having area around 1000 km
2 in Poland is equal
k ≈ 4 while for the similar size catchments of the rivers listed in the World Catalogue
of Maximum Observed Floods k ≈ 6.
A. Magnuszewski
Fig. 14.3 Location of river gauges used in the study to calculate flood potential index k in Poland
gauge. This feature can also be observed down the upper reach of Odra river. Such
pattern is characteristic for transit rivers where flood peak discharges are lowered in
a flood transformation process.
Small catchments in Poland having area 10–100 km
2 produce maximum discharge
10.8–12.2 times less than similar catchments of the World, while catchments of the
area 100,000–190,000 km
2 are 8.6–9.5 times less efficient in generating maximum
discharge. This phenomenon can be explained by the continental properties of Polish
climate and relief of the country with the dominating lowland except for southern
border with Sudety and Carpathian mountains.
The highest flood indexes in Poland are characteristic for Carpathian tributaries
of the upper Vistula river, such as Soła/ ˙
Zywiec gauge k = 4.31, Dunajec/Nowy
S˛ acz gauge k = 4.31 (Table 14.1). Comparison of maximum values of k index of
Polish rivers and rivers listed in the World Catalogue of Maximum Observed Floods
shows that Polish territory has much lower flood potential. For example, highest
flood potential of the catchments having area around 1000 km
2 in Poland is equal
k ≈ 4 while for the similar size catchments of the rivers listed in the World Catalogue
of Maximum Observed Floods k ≈ 6.