

14 Flood Potential of Polish Rivers
275
14.3 Flood Potential
Starting from XIX century many studies were undertaken to quantify river basins
characteristics and their influence on rainfall-runoff response. First empirical
formulas used in hydrology were using only area of the whole catchment as a independent variable. Area of the catchment affects not only the time of concentration
but also the total volume of run-off, since the size of the catchment correspond to
the size of convective clouds and frontal systems. Maximum discharge of the flood
peak is inversely related to size of the catchment; this is because the intensive storms
caused by convective clouds have a dimension of first-order catchments. Area of
the catchment is also correlated to almost all topographic characteristics such as
stream order, stream network length, main channel length, basin length. Because of
this correlation with other characteristics, it is possible to use only catchment area
to represent river size. There had been many attempts to find the relations between
catchment size and maximum discharge at the flood peak, such characteristic can
be used as a measure of flood potential. One of the better known is the index of
flood potential proposed by J. Françou and applied by [14] in the World Catalogue
of Maximum Observed Floods.
Flood potential k is a dimensionless index showing the efficiency of producing
maximum discharge from the given catchment area. Since the k index is used for
comparison of different size catchments of the world, it is standardized by maximum
discharge 10
6 m
3 s
−1 and maximum catchment area 10
8 km
2 physically possible on
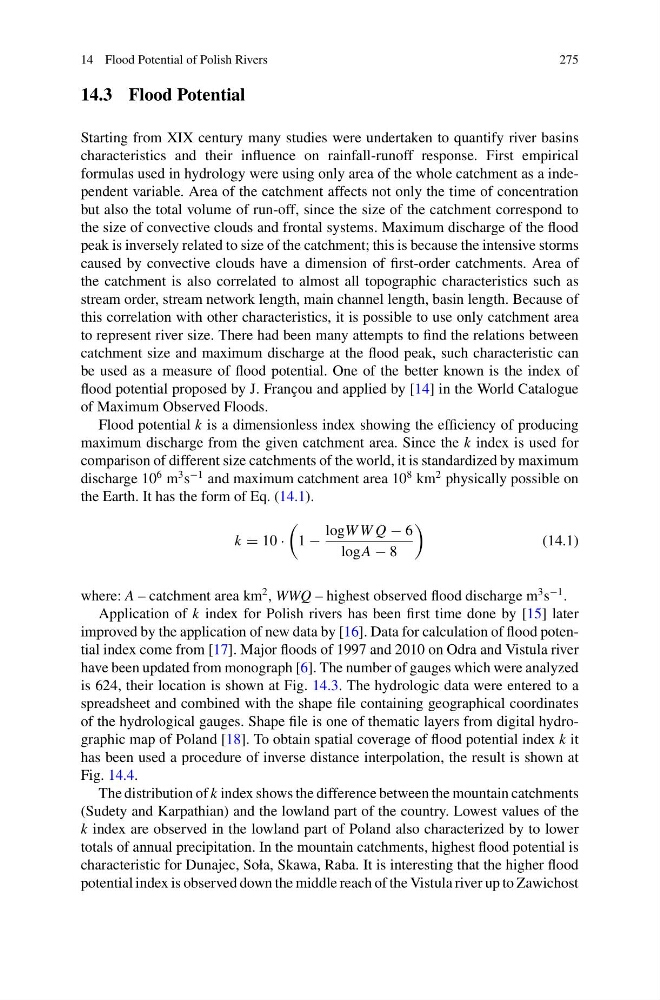
the Earth. It has the form of Eq. (14.1).
k = 10 ·
1 −
logW W Q − 6
logA − 8
(14.1)
where: A – catchment area km
2 , WWQ – highest observed flood discharge m
3 s
−1 .
Application of k index for Polish rivers has been first time done by [15] later
improved by the application of new data by [16]. Data for calculation of flood potential index come from [17]. Major floods of 1997 and 2010 on Odra and Vistula river
have been updated from monograph [6]. The number of gauges which were analyzed
is 624, their location is shown at Fig. 14.3. The hydrologic data were entered to a
spreadsheet and combined with the shape file containing geographical coordinates
of the hydrological gauges. Shape file is one of thematic layers from digital hydrographic map of Poland [18]. To obtain spatial coverage of flood potential index k it
has been used a procedure of inverse distance interpolation, the result is shown at
Fig. 14.4.
The distribution of k index shows the difference between the mountain catchments
(Sudety and Karpathian) and the lowland part of the country. Lowest values of the
k index are observed in the lowland part of Poland also characterized by to lower
totals of annual precipitation. In the mountain catchments, highest flood potential is
characteristic for Dunajec, Soła, Skawa, Raba. It is interesting that the higher flood
potential index is observed down the middle reach of the Vistula river up to Zawichost
275
14.3 Flood Potential
Starting from XIX century many studies were undertaken to quantify river basins
characteristics and their influence on rainfall-runoff response. First empirical
formulas used in hydrology were using only area of the whole catchment as a independent variable. Area of the catchment affects not only the time of concentration
but also the total volume of run-off, since the size of the catchment correspond to
the size of convective clouds and frontal systems. Maximum discharge of the flood
peak is inversely related to size of the catchment; this is because the intensive storms
caused by convective clouds have a dimension of first-order catchments. Area of
the catchment is also correlated to almost all topographic characteristics such as
stream order, stream network length, main channel length, basin length. Because of
this correlation with other characteristics, it is possible to use only catchment area
to represent river size. There had been many attempts to find the relations between
catchment size and maximum discharge at the flood peak, such characteristic can
be used as a measure of flood potential. One of the better known is the index of
flood potential proposed by J. Françou and applied by [14] in the World Catalogue
of Maximum Observed Floods.
Flood potential k is a dimensionless index showing the efficiency of producing
maximum discharge from the given catchment area. Since the k index is used for
comparison of different size catchments of the world, it is standardized by maximum
discharge 10
6 m
3 s
−1 and maximum catchment area 10
8 km
2 physically possible on
the Earth. It has the form of Eq. (14.1).
k = 10 ·
1 −
logW W Q − 6
logA − 8
(14.1)
where: A – catchment area km
2 , WWQ – highest observed flood discharge m
3 s
−1 .
Application of k index for Polish rivers has been first time done by [15] later
improved by the application of new data by [16]. Data for calculation of flood potential index come from [17]. Major floods of 1997 and 2010 on Odra and Vistula river
have been updated from monograph [6]. The number of gauges which were analyzed
is 624, their location is shown at Fig. 14.3. The hydrologic data were entered to a
spreadsheet and combined with the shape file containing geographical coordinates
of the hydrological gauges. Shape file is one of thematic layers from digital hydrographic map of Poland [18]. To obtain spatial coverage of flood potential index k it
has been used a procedure of inverse distance interpolation, the result is shown at
Fig. 14.4.
The distribution of k index shows the difference between the mountain catchments
(Sudety and Karpathian) and the lowland part of the country. Lowest values of the
k index are observed in the lowland part of Poland also characterized by to lower
totals of annual precipitation. In the mountain catchments, highest flood potential is
characteristic for Dunajec, Soła, Skawa, Raba. It is interesting that the higher flood
potential index is observed down the middle reach of the Vistula river up to Zawichost