

11 Low-Flows in Polish Rivers
223
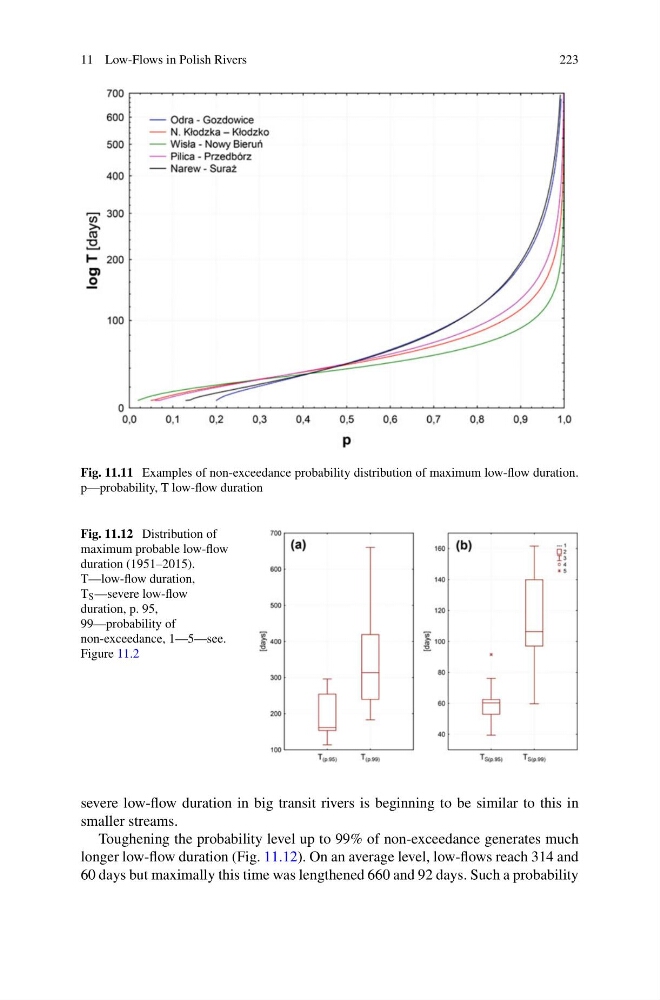
Fig. 11.11 Examples of non-exceedance probability distribution of maximum low-flow duration.
p—probability, T low-flow duration
Fig. 11.12 Distribution of
maximum probable low-flow
duration (1951–2015).
T—low-flow duration,
T S —severe low-flow
duration, p. 95,
99—probability of
non-exceedance, 1—5—see.
Figure 11.2
severe low-flow duration in big transit rivers is beginning to be similar to this in
smaller streams.
Toughening the probability level up to 99% of non-exceedance generates much
longer low-flow duration (Fig. 11.12). On an average level, low-flows reach 314 and
60 days but maximally this time was lengthened 660 and 92 days. Such a probability
223
Fig. 11.11 Examples of non-exceedance probability distribution of maximum low-flow duration.
p—probability, T low-flow duration
Fig. 11.12 Distribution of
maximum probable low-flow
duration (1951–2015).
T—low-flow duration,
T S —severe low-flow
duration, p. 95,
99—probability of
non-exceedance, 1—5—see.
Figure 11.2
severe low-flow duration in big transit rivers is beginning to be similar to this in
smaller streams.
Toughening the probability level up to 99% of non-exceedance generates much
longer low-flow duration (Fig. 11.12). On an average level, low-flows reach 314 and
60 days but maximally this time was lengthened 660 and 92 days. Such a probability