

222
E. Tomaszewski and K. Kubiak-Wójcicka
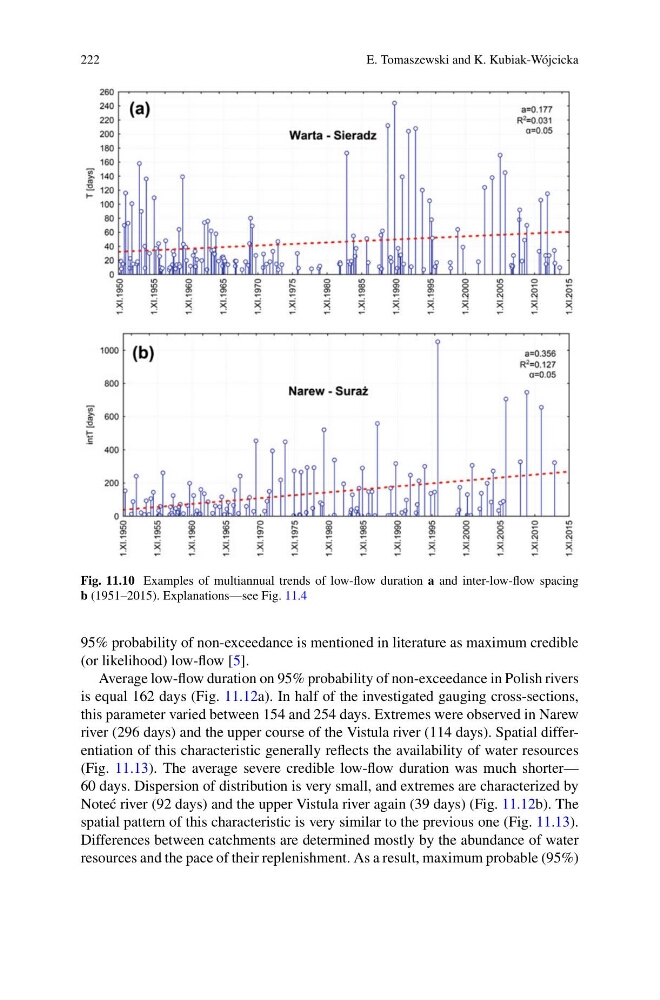
Fig. 11.10 Examples of multiannual trends of low-flow duration a and inter-low-flow spacing
b (1951–2015). Explanations—see Fig. 11.4
95% probability of non-exceedance is mentioned in literature as maximum credible
(or likelihood) low-flow [5].
Average low-flow duration on 95% probability of non-exceedance in Polish rivers
is equal 162 days (Fig. 11.12a). In half of the investigated gauging cross-sections,
this parameter varied between 154 and 254 days. Extremes were observed in Narew
river (296 days) and the upper course of the Vistula river (114 days). Spatial differentiation of this characteristic generally reflects the availability of water resources
(Fig. 11.13). The average severe credible low-flow duration was much shorter—
60 days. Dispersion of distribution is very small, and extremes are characterized by
Note´ c river (92 days) and the upper Vistula river again (39 days) (Fig. 11.12b). The
spatial pattern of this characteristic is very similar to the previous one (Fig. 11.13).
Differences between catchments are determined mostly by the abundance of water
resources and the pace of their replenishment. As a result, maximum probable (95%)
E. Tomaszewski and K. Kubiak-Wójcicka
Fig. 11.10 Examples of multiannual trends of low-flow duration a and inter-low-flow spacing
b (1951–2015). Explanations—see Fig. 11.4
95% probability of non-exceedance is mentioned in literature as maximum credible
(or likelihood) low-flow [5].
Average low-flow duration on 95% probability of non-exceedance in Polish rivers
is equal 162 days (Fig. 11.12a). In half of the investigated gauging cross-sections,
this parameter varied between 154 and 254 days. Extremes were observed in Narew
river (296 days) and the upper course of the Vistula river (114 days). Spatial differentiation of this characteristic generally reflects the availability of water resources
(Fig. 11.13). The average severe credible low-flow duration was much shorter—
60 days. Dispersion of distribution is very small, and extremes are characterized by
Note´ c river (92 days) and the upper Vistula river again (39 days) (Fig. 11.12b). The
spatial pattern of this characteristic is very similar to the previous one (Fig. 11.13).
Differences between catchments are determined mostly by the abundance of water
resources and the pace of their replenishment. As a result, maximum probable (95%)