

224
E. Tomaszewski and K. Kubiak-Wójcicka
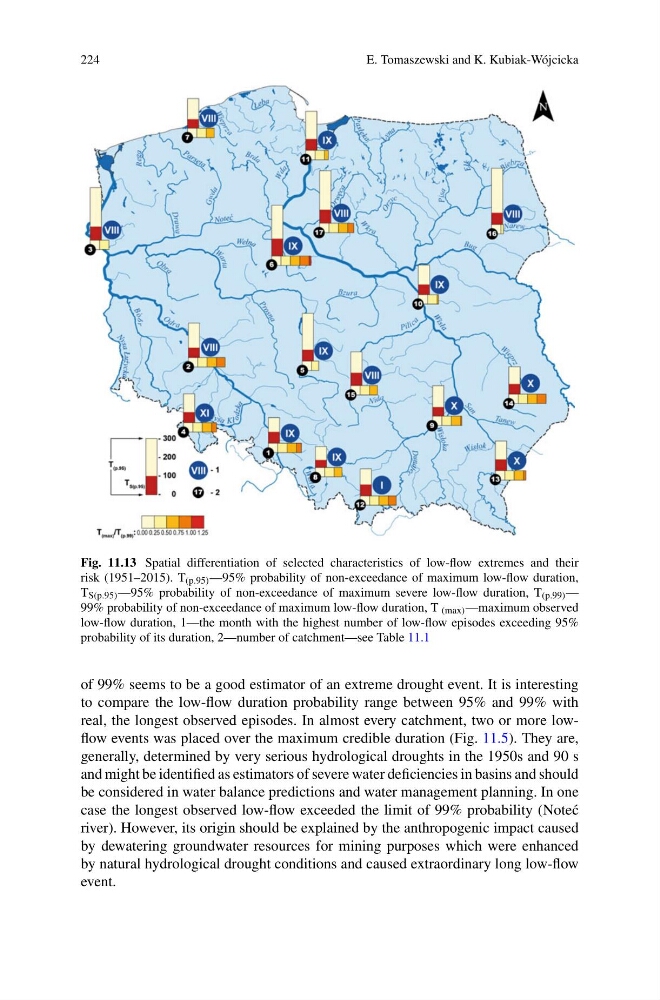
Fig. 11.13 Spatial differentiation of selected characteristics of low-flow extremes and their
risk (1951–2015). T (p.95) —95% probability of non-exceedance of maximum low-flow duration,
T S(p.95) —95% probability of non-exceedance of maximum severe low-flow duration, T (p.99) —
99% probability of non-exceedance of maximum low-flow duration, T (max) —maximum observed
low-flow duration, 1—the month with the highest number of low-flow episodes exceeding 95%
probability of its duration, 2—number of catchment—see Table 11.1
of 99% seems to be a good estimator of an extreme drought event. It is interesting
to compare the low-flow duration probability range between 95% and 99% with
real, the longest observed episodes. In almost every catchment, two or more lowflow events was placed over the maximum credible duration (Fig. 11.5). They are,
generally, determined by very serious hydrological droughts in the 1950s and 90 s
and might be identified as estimators of severe water deficiencies in basins and should
be considered in water balance predictions and water management planning. In one
case the longest observed low-flow exceeded the limit of 99% probability (Note´ c
river). However, its origin should be explained by the anthropogenic impact caused
by dewatering groundwater resources for mining purposes which were enhanced
by natural hydrological drought conditions and caused extraordinary long low-flow
event.
E. Tomaszewski and K. Kubiak-Wójcicka
Fig. 11.13 Spatial differentiation of selected characteristics of low-flow extremes and their
risk (1951–2015). T (p.95) —95% probability of non-exceedance of maximum low-flow duration,
T S(p.95) —95% probability of non-exceedance of maximum severe low-flow duration, T (p.99) —
99% probability of non-exceedance of maximum low-flow duration, T (max) —maximum observed
low-flow duration, 1—the month with the highest number of low-flow episodes exceeding 95%
probability of its duration, 2—number of catchment—see Table 11.1
of 99% seems to be a good estimator of an extreme drought event. It is interesting
to compare the low-flow duration probability range between 95% and 99% with
real, the longest observed episodes. In almost every catchment, two or more lowflow events was placed over the maximum credible duration (Fig. 11.5). They are,
generally, determined by very serious hydrological droughts in the 1950s and 90 s
and might be identified as estimators of severe water deficiencies in basins and should
be considered in water balance predictions and water management planning. In one
case the longest observed low-flow exceeded the limit of 99% probability (Note´ c
river). However, its origin should be explained by the anthropogenic impact caused
by dewatering groundwater resources for mining purposes which were enhanced
by natural hydrological drought conditions and caused extraordinary long low-flow
event.