

11 Low-Flows in Polish Rivers
217
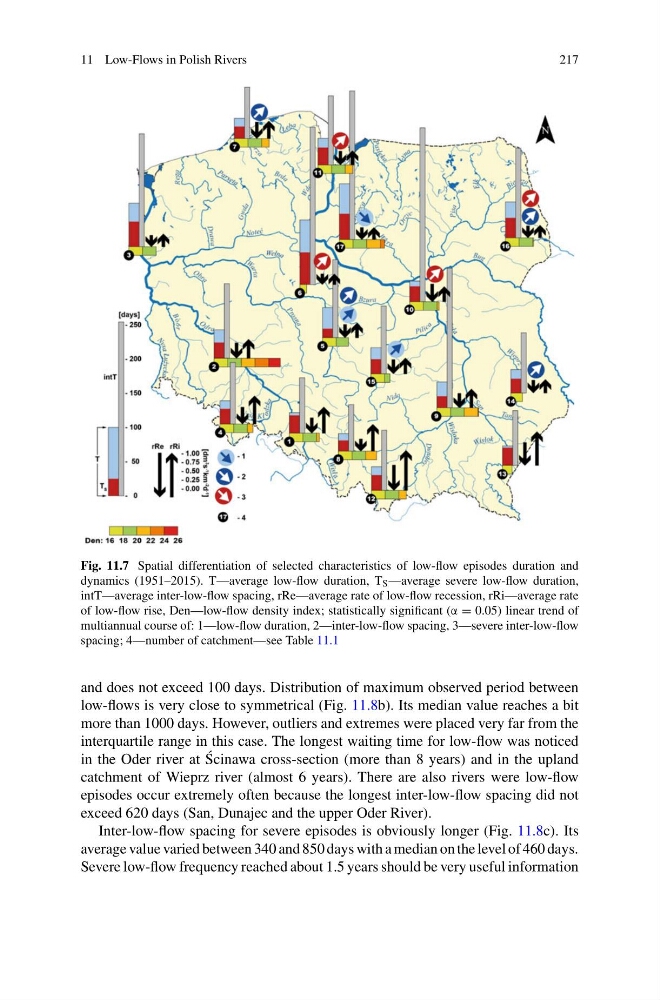
Fig. 11.7 Spatial differentiation of selected characteristics of low-flow episodes duration and
dynamics (1951–2015). T—average low-flow duration, T S —average severe low-flow duration,
intT—average inter-low-flow spacing, rRe—average rate of low-flow recession, rRi—average rate
of low-flow rise, Den—low-flow density index; statistically significant (α = 0.05) linear trend of
multiannual course of: 1—low-flow duration, 2—inter-low-flow spacing, 3—severe inter-low-flow
spacing; 4—number of catchment—see Table 11.1
and does not exceed 100 days. Distribution of maximum observed period between
low-flows is very close to symmetrical (Fig. 11.8b). Its median value reaches a bit
more than 1000 days. However, outliers and extremes were placed very far from the
interquartile range in this case. The longest waiting time for low-flow was noticed
in the Oder river at ´
Scinawa cross-section (more than 8 years) and in the upland
catchment of Wieprz river (almost 6 years). There are also rivers were low-flow
episodes occur extremely often because the longest inter-low-flow spacing did not
exceed 620 days (San, Dunajec and the upper Oder River).
Inter-low-flow spacing for severe episodes is obviously longer (Fig. 11.8c). Its
average value varied between 340 and 850 days with a median on the level of 460 days.
Severe low-flow frequency reached about 1.5 years should be very useful information
217
Fig. 11.7 Spatial differentiation of selected characteristics of low-flow episodes duration and
dynamics (1951–2015). T—average low-flow duration, T S —average severe low-flow duration,
intT—average inter-low-flow spacing, rRe—average rate of low-flow recession, rRi—average rate
of low-flow rise, Den—low-flow density index; statistically significant (α = 0.05) linear trend of
multiannual course of: 1—low-flow duration, 2—inter-low-flow spacing, 3—severe inter-low-flow
spacing; 4—number of catchment—see Table 11.1
and does not exceed 100 days. Distribution of maximum observed period between
low-flows is very close to symmetrical (Fig. 11.8b). Its median value reaches a bit
more than 1000 days. However, outliers and extremes were placed very far from the
interquartile range in this case. The longest waiting time for low-flow was noticed
in the Oder river at ´
Scinawa cross-section (more than 8 years) and in the upland
catchment of Wieprz river (almost 6 years). There are also rivers were low-flow
episodes occur extremely often because the longest inter-low-flow spacing did not
exceed 620 days (San, Dunajec and the upper Oder River).
Inter-low-flow spacing for severe episodes is obviously longer (Fig. 11.8c). Its
average value varied between 340 and 850 days with a median on the level of 460 days.
Severe low-flow frequency reached about 1.5 years should be very useful information