

216
E. Tomaszewski and K. Kubiak-Wójcicka
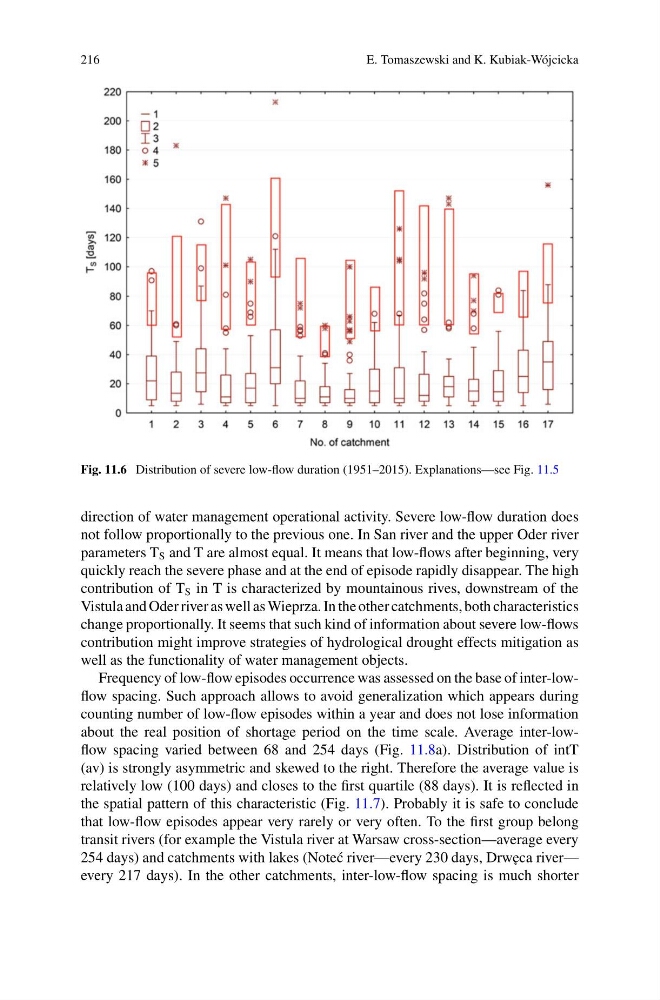
Fig. 11.6 Distribution of severe low-flow duration (1951–2015). Explanations—see Fig. 11.5
direction of water management operational activity. Severe low-flow duration does
not follow proportionally to the previous one. In San river and the upper Oder river
parameters T S and T are almost equal. It means that low-flows after beginning, very
quickly reach the severe phase and at the end of episode rapidly disappear. The high
contribution of T S in T is characterized by mountainous rives, downstream of the
Vistula and Oder river as well as Wieprza. In the other catchments, both characteristics
change proportionally. It seems that such kind of information about severe low-flows
contribution might improve strategies of hydrological drought effects mitigation as
well as the functionality of water management objects.
Frequency of low-flow episodes occurrence was assessed on the base of inter-lowflow spacing. Such approach allows to avoid generalization which appears during
counting number of low-flow episodes within a year and does not lose information
about the real position of shortage period on the time scale. Average inter-lowflow spacing varied between 68 and 254 days (Fig. 11.8a). Distribution of intT
(av) is strongly asymmetric and skewed to the right. Therefore the average value is
relatively low (100 days) and closes to the first quartile (88 days). It is reflected in
the spatial pattern of this characteristic (Fig. 11.7). Probably it is safe to conclude
that low-flow episodes appear very rarely or very often. To the first group belong
transit rivers (for example the Vistula river at Warsaw cross-section—average every
254 days) and catchments with lakes (Note´ c river—every 230 days, Drw˛ eca river—
every 217 days). In the other catchments, inter-low-flow spacing is much shorter
E. Tomaszewski and K. Kubiak-Wójcicka
Fig. 11.6 Distribution of severe low-flow duration (1951–2015). Explanations—see Fig. 11.5
direction of water management operational activity. Severe low-flow duration does
not follow proportionally to the previous one. In San river and the upper Oder river
parameters T S and T are almost equal. It means that low-flows after beginning, very
quickly reach the severe phase and at the end of episode rapidly disappear. The high
contribution of T S in T is characterized by mountainous rives, downstream of the
Vistula and Oder river as well as Wieprza. In the other catchments, both characteristics
change proportionally. It seems that such kind of information about severe low-flows
contribution might improve strategies of hydrological drought effects mitigation as
well as the functionality of water management objects.
Frequency of low-flow episodes occurrence was assessed on the base of inter-lowflow spacing. Such approach allows to avoid generalization which appears during
counting number of low-flow episodes within a year and does not lose information
about the real position of shortage period on the time scale. Average inter-lowflow spacing varied between 68 and 254 days (Fig. 11.8a). Distribution of intT
(av) is strongly asymmetric and skewed to the right. Therefore the average value is
relatively low (100 days) and closes to the first quartile (88 days). It is reflected in
the spatial pattern of this characteristic (Fig. 11.7). Probably it is safe to conclude
that low-flow episodes appear very rarely or very often. To the first group belong
transit rivers (for example the Vistula river at Warsaw cross-section—average every
254 days) and catchments with lakes (Note´ c river—every 230 days, Drw˛ eca river—
every 217 days). In the other catchments, inter-low-flow spacing is much shorter