

212
E. Tomaszewski and K. Kubiak-Wójcicka
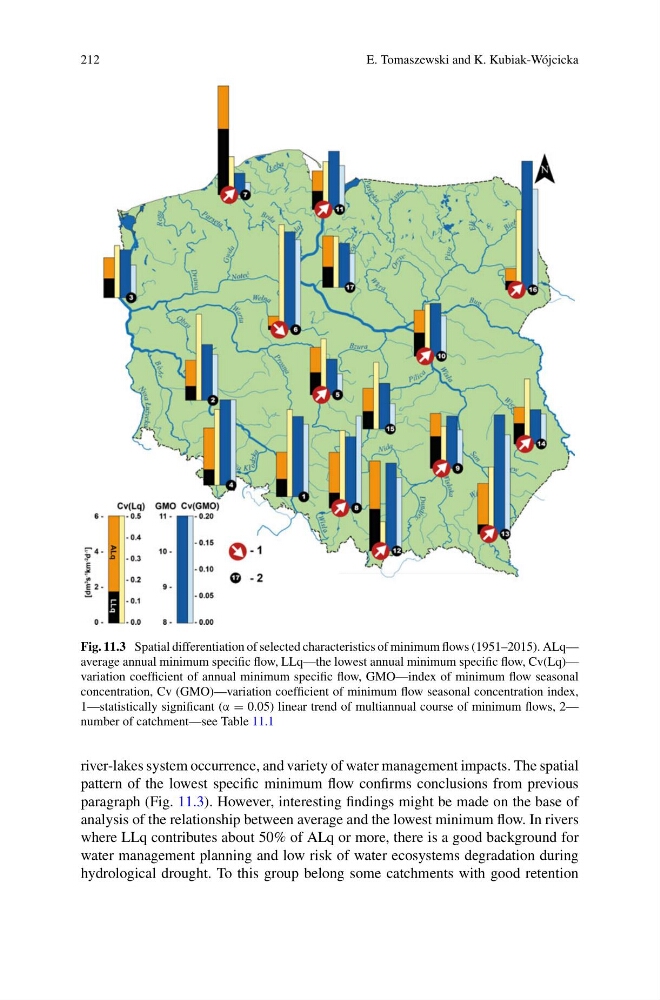
Fig. 11.3 Spatial differentiation of selected characteristics of minimum flows (1951–2015). ALq—
average annual minimum specific flow, LLq—the lowest annual minimum specific flow, Cv(Lq)—
variation coefficient of annual minimum specific flow, GMO—index of minimum flow seasonal
concentration, Cv (GMO)—variation coefficient of minimum flow seasonal concentration index,
1—statistically significant (α = 0.05) linear trend of multiannual course of minimum flows, 2—
number of catchment—see Table 11.1
river-lakes system occurrence, and variety of water management impacts. The spatial
pattern of the lowest specific minimum flow confirms conclusions from previous
paragraph (Fig. 11.3). However, interesting findings might be made on the base of
analysis of the relationship between average and the lowest minimum flow. In rivers
where LLq contributes about 50% of ALq or more, there is a good background for
water management planning and low risk of water ecosystems degradation during
hydrological drought. To this group belong some catchments with good retention
E. Tomaszewski and K. Kubiak-Wójcicka
Fig. 11.3 Spatial differentiation of selected characteristics of minimum flows (1951–2015). ALq—
average annual minimum specific flow, LLq—the lowest annual minimum specific flow, Cv(Lq)—
variation coefficient of annual minimum specific flow, GMO—index of minimum flow seasonal
concentration, Cv (GMO)—variation coefficient of minimum flow seasonal concentration index,
1—statistically significant (α = 0.05) linear trend of multiannual course of minimum flows, 2—
number of catchment—see Table 11.1
river-lakes system occurrence, and variety of water management impacts. The spatial
pattern of the lowest specific minimum flow confirms conclusions from previous
paragraph (Fig. 11.3). However, interesting findings might be made on the base of
analysis of the relationship between average and the lowest minimum flow. In rivers
where LLq contributes about 50% of ALq or more, there is a good background for
water management planning and low risk of water ecosystems degradation during
hydrological drought. To this group belong some catchments with good retention