

11 Low-Flows in Polish Rivers
211
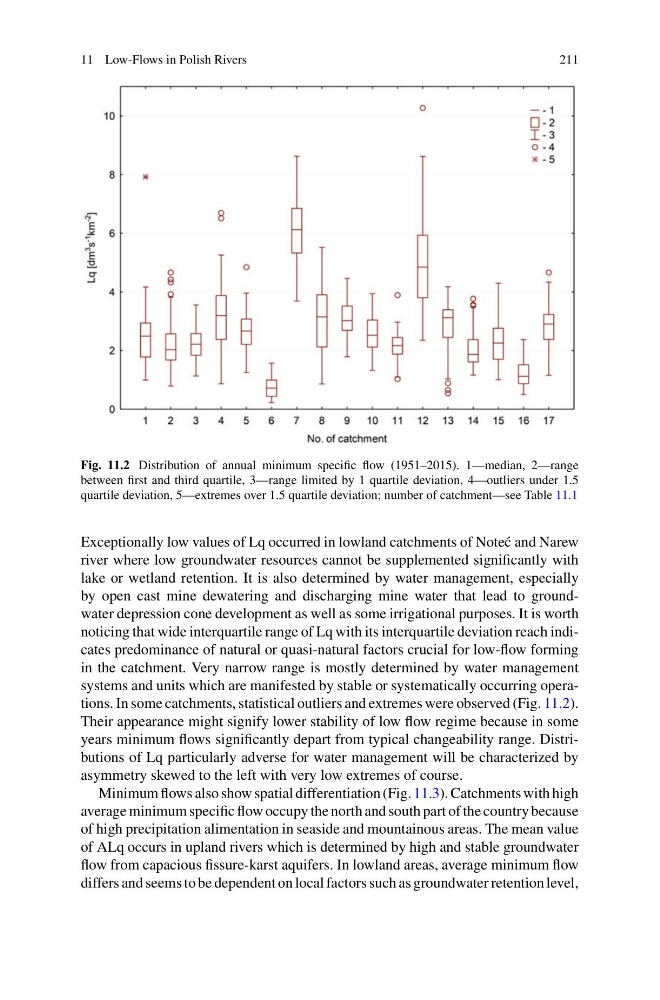
Fig. 11.2 Distribution of annual minimum specific flow (1951–2015). 1—median, 2—range
between first and third quartile, 3—range limited by 1 quartile deviation, 4—outliers under 1.5
quartile deviation, 5—extremes over 1.5 quartile deviation; number of catchment—see Table 11.1
Exceptionally low values of Lq occurred in lowland catchments of Note´ c and Narew
river where low groundwater resources cannot be supplemented significantly with
lake or wetland retention. It is also determined by water management, especially
by open cast mine dewatering and discharging mine water that lead to groundwater depression cone development as well as some irrigational purposes. It is worth
noticing that wide interquartile range of Lq with its interquartile deviation reach indicates predominance of natural or quasi-natural factors crucial for low-flow forming
in the catchment. Very narrow range is mostly determined by water management
systems and units which are manifested by stable or systematically occurring operations. In some catchments, statistical outliers and extremes were observed (Fig. 11.2).
Their appearance might signify lower stability of low flow regime because in some
years minimum flows significantly depart from typical changeability range. Distributions of Lq particularly adverse for water management will be characterized by
asymmetry skewed to the left with very low extremes of course.
Minimum flows also show spatial differentiation (Fig. 11.3). Catchments with high
average minimum specific flow occupy the north and south part of the country because
of high precipitation alimentation in seaside and mountainous areas. The mean value
of ALq occurs in upland rivers which is determined by high and stable groundwater
flow from capacious fissure-karst aquifers. In lowland areas, average minimum flow
differs and seems to be dependent on local factors such as groundwater retention level,
211
Fig. 11.2 Distribution of annual minimum specific flow (1951–2015). 1—median, 2—range
between first and third quartile, 3—range limited by 1 quartile deviation, 4—outliers under 1.5
quartile deviation, 5—extremes over 1.5 quartile deviation; number of catchment—see Table 11.1
Exceptionally low values of Lq occurred in lowland catchments of Note´ c and Narew
river where low groundwater resources cannot be supplemented significantly with
lake or wetland retention. It is also determined by water management, especially
by open cast mine dewatering and discharging mine water that lead to groundwater depression cone development as well as some irrigational purposes. It is worth
noticing that wide interquartile range of Lq with its interquartile deviation reach indicates predominance of natural or quasi-natural factors crucial for low-flow forming
in the catchment. Very narrow range is mostly determined by water management
systems and units which are manifested by stable or systematically occurring operations. In some catchments, statistical outliers and extremes were observed (Fig. 11.2).
Their appearance might signify lower stability of low flow regime because in some
years minimum flows significantly depart from typical changeability range. Distributions of Lq particularly adverse for water management will be characterized by
asymmetry skewed to the left with very low extremes of course.
Minimum flows also show spatial differentiation (Fig. 11.3). Catchments with high
average minimum specific flow occupy the north and south part of the country because
of high precipitation alimentation in seaside and mountainous areas. The mean value
of ALq occurs in upland rivers which is determined by high and stable groundwater
flow from capacious fissure-karst aquifers. In lowland areas, average minimum flow
differs and seems to be dependent on local factors such as groundwater retention level,