

490
Kuipers et al. [12, 99] reported from their detailed FT studies that α-olefin hydrogenates at one site and then reinserted into another site the vicinity. Prior to the reinsertion on a particular site, the olefin long-chain breaks the bond from its origin
and remains attached to the catalyst surface with the weak van der Waals forces,
which increases the probability of re-insertion than the desorption. The rate of reinsertion compared to desorption increases with chain length; however, the small
chain length α-olefin prefer to desorb in the vapor phase or can adhere to the next
vicinal site for the hydrogenation reaction, which aids to the hydrogenation of these
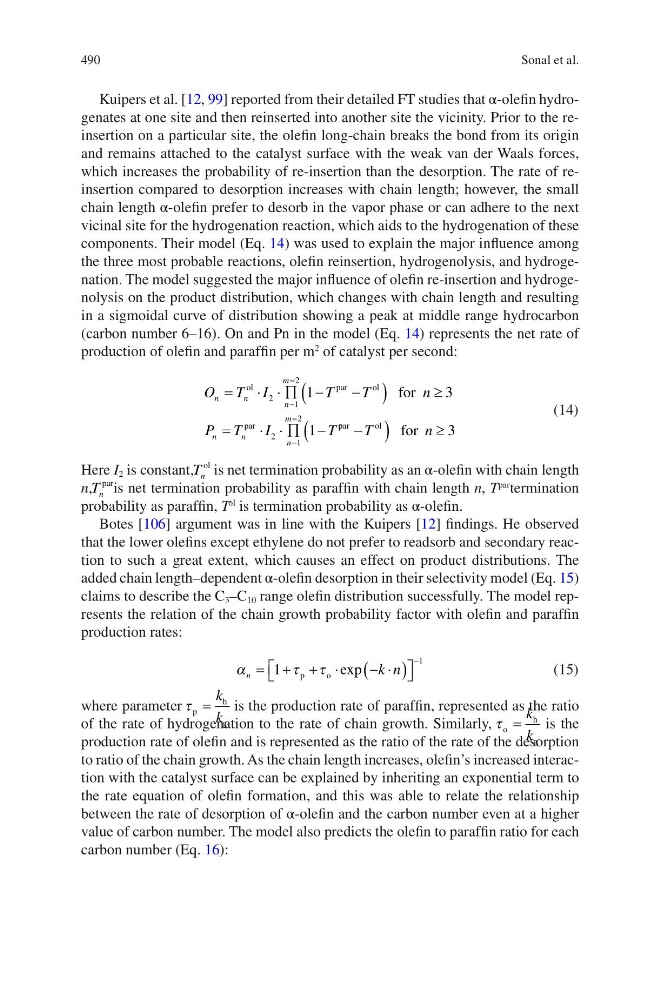
components. Their model (Eq. 14) was used to explain the major influence among
the three most probable reactions, olefin reinsertion, hydrogenolysis, and hydrogenation. The model suggested the major influence of olefin re-insertion and hydrogenolysis on the product distribution, which changes with chain length and resulting
in a sigmoidal curve of distribution showing a peak at middle range hydrocarbon
(carbon number 6–16). On and Pn in the model (Eq. 14) represents the net rate of
production of olefin and paraffin per m
2
of catalyst per second:
O T I
T
T
n
P T
I
T
n
n
n
m
n
n
n
m
=
⋅ ⋅ ∏ −
−
(
)
≥
=
⋅ ⋅ ∏ −
−
=
−
=
ol
par
o l
par
for
2
1
2
2
1
2
1
3
1
p par
o l
for
−
(
)
≥
T
n 3
(14)
Here I 2 is constant,T n
ol is net termination probability as an α-olefin with chain length
n,T n
par is net termination probability as paraffin with chain length n, T
par
termination
probability as paraffin, T
ol
is termination probability as α-olefin.
Botes [106] argument was in line with the Kuipers [12] findings. He observed
that the lower olefins except ethylene do not prefer to readsorb and secondary reaction to such a great extent, which causes an effect on product distributions. The
added chain length–dependent α-olefin desorption in their selectivity model (Eq. 15)
claims to describe the C 3 –C 10 range olefin distribution successfully. The model represents the relation of the chain growth probability factor with olefin and paraffin
production rates:
α
τ τ
n
k n
= + + ⋅
− ⋅
(
)
−
1
1
p
o exp
(15)
where parameter τ p
h
g
=
k
k
is the production rate of paraffin, represented as the ratio
of the rate of hydrogenation to the rate of chain growth. Similarly, τ o
h
g
=
k
k
is the
production rate of olefin and is represented as the ratio of the rate of the desorption
to ratio of the chain growth. As the chain length increases, olefin’s increased interaction with the catalyst surface can be explained by inheriting an exponential term to
the rate equation of olefin formation, and this was able to relate the relationship
between the rate of desorption of α-olefin and the carbon number even at a higher
value of carbon number. The model also predicts the olefin to paraffin ratio for each
carbon number (Eq. 16):
Sonal et al.
Kuipers et al. [12, 99] reported from their detailed FT studies that α-olefin hydrogenates at one site and then reinserted into another site the vicinity. Prior to the reinsertion on a particular site, the olefin long-chain breaks the bond from its origin
and remains attached to the catalyst surface with the weak van der Waals forces,
which increases the probability of re-insertion than the desorption. The rate of reinsertion compared to desorption increases with chain length; however, the small
chain length α-olefin prefer to desorb in the vapor phase or can adhere to the next
vicinal site for the hydrogenation reaction, which aids to the hydrogenation of these
components. Their model (Eq. 14) was used to explain the major influence among
the three most probable reactions, olefin reinsertion, hydrogenolysis, and hydrogenation. The model suggested the major influence of olefin re-insertion and hydrogenolysis on the product distribution, which changes with chain length and resulting
in a sigmoidal curve of distribution showing a peak at middle range hydrocarbon
(carbon number 6–16). On and Pn in the model (Eq. 14) represents the net rate of
production of olefin and paraffin per m
2
of catalyst per second:
O T I
T
T
n
P T
I
T
n
n
n
m
n
n
n
m
=
⋅ ⋅ ∏ −
−
(
)
≥
=
⋅ ⋅ ∏ −
−
=
−
=
ol
par
o l
par
for
2
1
2
2
1
2
1
3
1
p par
o l
for
−
(
)
≥
T
n 3
(14)
Here I 2 is constant,T n
ol is net termination probability as an α-olefin with chain length
n,T n
par is net termination probability as paraffin with chain length n, T
par
termination
probability as paraffin, T
ol
is termination probability as α-olefin.
Botes [106] argument was in line with the Kuipers [12] findings. He observed
that the lower olefins except ethylene do not prefer to readsorb and secondary reaction to such a great extent, which causes an effect on product distributions. The
added chain length–dependent α-olefin desorption in their selectivity model (Eq. 15)
claims to describe the C 3 –C 10 range olefin distribution successfully. The model represents the relation of the chain growth probability factor with olefin and paraffin
production rates:
α
τ τ
n
k n
= + + ⋅
− ⋅
(
)
−
1
1
p
o exp
(15)
where parameter τ p
h
g
=
k
k
is the production rate of paraffin, represented as the ratio
of the rate of hydrogenation to the rate of chain growth. Similarly, τ o
h
g
=
k
k
is the
production rate of olefin and is represented as the ratio of the rate of the desorption
to ratio of the chain growth. As the chain length increases, olefin’s increased interaction with the catalyst surface can be explained by inheriting an exponential term to
the rate equation of olefin formation, and this was able to relate the relationship
between the rate of desorption of α-olefin and the carbon number even at a higher
value of carbon number. The model also predicts the olefin to paraffin ratio for each
carbon number (Eq. 16):
Sonal et al.