

emissions and/or underestimations of the sinks. The latter was more likely due to
the high variability of land sinks and to an underestimation of the ocean sink.
In the decade 2008–2017, China’s and India’s average carbon emissions
increased by 3 and 5.2% yr
−1 , whereas emissions from the EU and the USA
decreased by 1.8 and 0.9% yr
−1 . These percentages correspond to 2.3, 0.91, 0.62,
and 0.66 Gt CO 2 , respectively (Le Quéré et al. 2018).
From 2016 to 2017, the estimated global fossil carbon dioxide emissions grew
by about 1.6%, reaching an average of about 36.2 Gt CO 2 yr
−1 , due mainly to coal
(40%), oil (35%), gas (20%), and cement industry (4%). This EF increase in 2017
followed for three years with little or no emissions growth.
As shown in Fig. 8.6, the total amount of CO 2 emissions is quite asymmetric in
relation to countries and economic areas and these distortions have been an element
of disagreement between countries when it comes to sharing mitigation costs. In
fact, four blocks emit more carbon dioxide than the rest of the world.
The differences between economic blocks and countries reflect the levels of
economic development and industrialization almost always correlated with the
intensity of the energy consumption, which ends up translating into the per capita
values of CO 2 emission as shown in Fig. 8.7.
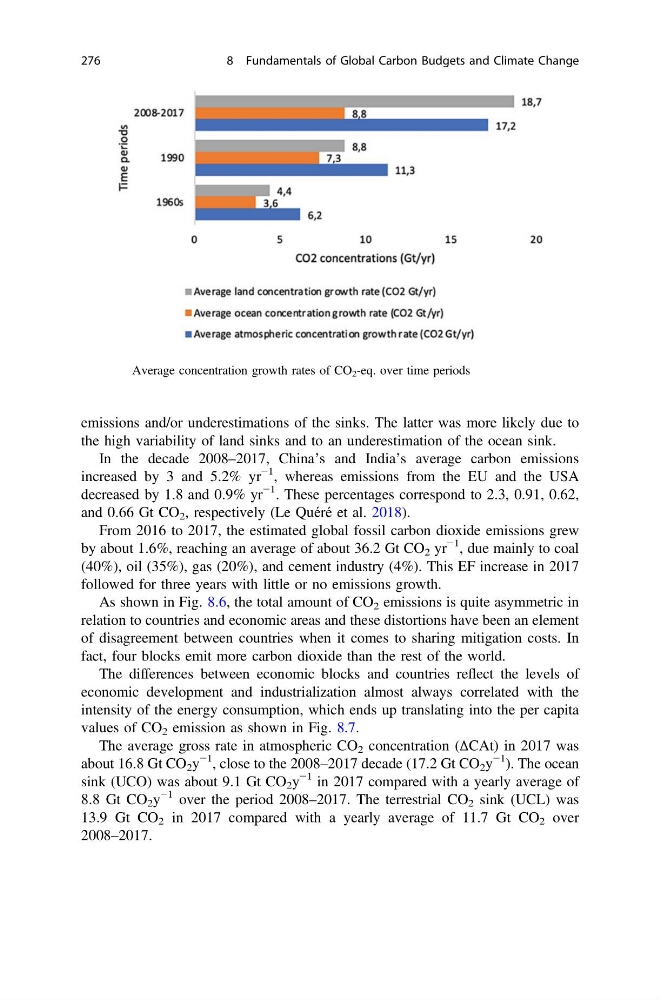
The average gross rate in atmospheric CO 2 concentration (ΔCAt) in 2017 was
about 16.8 Gt CO 2 y
−1 , close to the 2008–2017 decade (17.2 Gt CO 2 y
−1 ). The ocean
sink (UCO) was about 9.1 Gt CO 2 y
−1 in 2017 compared with a yearly average of
8.8 Gt CO 2 y
−1 over the period 2008–2017. The terrestrial CO 2 sink (UCL) was
13.9 Gt CO 2 in 2017 compared with a yearly average of 11.7 Gt CO 2 over
2008–2017.
Fig. 8.5 Average concentration growth rates of CO 2 -eq. over time periods
276
8 Fundamentals of Global Carbon Budgets and Climate Change
the high variability of land sinks and to an underestimation of the ocean sink.
In the decade 2008–2017, China’s and India’s average carbon emissions
increased by 3 and 5.2% yr
−1 , whereas emissions from the EU and the USA
decreased by 1.8 and 0.9% yr
−1 . These percentages correspond to 2.3, 0.91, 0.62,
and 0.66 Gt CO 2 , respectively (Le Quéré et al. 2018).
From 2016 to 2017, the estimated global fossil carbon dioxide emissions grew
by about 1.6%, reaching an average of about 36.2 Gt CO 2 yr
−1 , due mainly to coal
(40%), oil (35%), gas (20%), and cement industry (4%). This EF increase in 2017
followed for three years with little or no emissions growth.
As shown in Fig. 8.6, the total amount of CO 2 emissions is quite asymmetric in
relation to countries and economic areas and these distortions have been an element
of disagreement between countries when it comes to sharing mitigation costs. In
fact, four blocks emit more carbon dioxide than the rest of the world.
The differences between economic blocks and countries reflect the levels of
economic development and industrialization almost always correlated with the
intensity of the energy consumption, which ends up translating into the per capita
values of CO 2 emission as shown in Fig. 8.7.
The average gross rate in atmospheric CO 2 concentration (ΔCAt) in 2017 was
about 16.8 Gt CO 2 y
−1 , close to the 2008–2017 decade (17.2 Gt CO 2 y
−1 ). The ocean
sink (UCO) was about 9.1 Gt CO 2 y
−1 in 2017 compared with a yearly average of
8.8 Gt CO 2 y
−1 over the period 2008–2017. The terrestrial CO 2 sink (UCL) was
13.9 Gt CO 2 in 2017 compared with a yearly average of 11.7 Gt CO 2 over
2008–2017.
Fig. 8.5 Average concentration growth rates of CO 2 -eq. over time periods
276
8 Fundamentals of Global Carbon Budgets and Climate Change