

Despite the somewhat negative panorama at the global level, CO 2 emissions
decreased significantly in a group of 19 countries within Europe and North America
which were responsible for about 20% of the emissions. In 2018, the total CO 2
emissions were about 37.1 Gt, compared with 2290 Gt CO 2 for the accumulated
emissions over the period 1870–2018. In that year, the atmospheric CO 2 growth
concentration (ΔCAt) averaged around 18 Gt CO 2 , corresponding to an average
atmospheric concentration of about 407 ppm. Combined global ocean and land
sinks were about 24 Gt CO 2 . Assuming a probability of 66%, a net negative global
GHG in 2060 and 2080 is forecasted, corresponding to global average temperature
increases of around 1.7 and 1.3 °C by 2100 (Jackson et al. 2018).
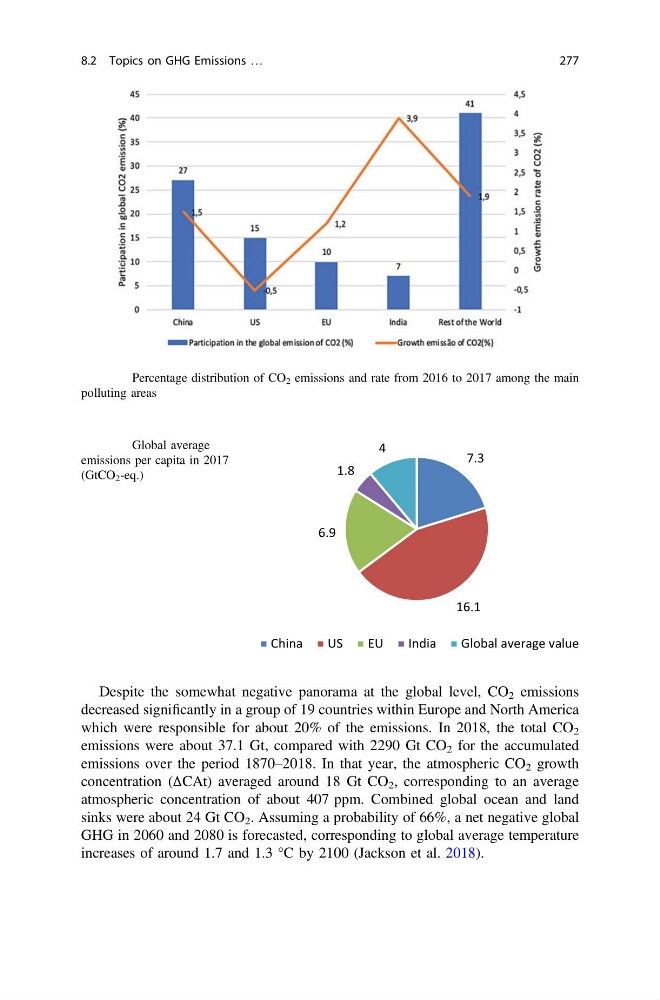
Fig. 8.6 Percentage distribution of CO 2 emissions and rate from 2016 to 2017 among the main
polluting areas
7.3
16.1
6.9
1.8
4
China
US
EU
India
Global average value
Fig. 8.7 Global average
emissions per capita in 2017
(GtCO 2 -eq.)
8.2 Topics on GHG Emissions …
277
decreased significantly in a group of 19 countries within Europe and North America
which were responsible for about 20% of the emissions. In 2018, the total CO 2
emissions were about 37.1 Gt, compared with 2290 Gt CO 2 for the accumulated
emissions over the period 1870–2018. In that year, the atmospheric CO 2 growth
concentration (ΔCAt) averaged around 18 Gt CO 2 , corresponding to an average
atmospheric concentration of about 407 ppm. Combined global ocean and land
sinks were about 24 Gt CO 2 . Assuming a probability of 66%, a net negative global
GHG in 2060 and 2080 is forecasted, corresponding to global average temperature
increases of around 1.7 and 1.3 °C by 2100 (Jackson et al. 2018).
Fig. 8.6 Percentage distribution of CO 2 emissions and rate from 2016 to 2017 among the main
polluting areas
7.3
16.1
6.9
1.8
4
China
US
EU
India
Global average value
Fig. 8.7 Global average
emissions per capita in 2017
(GtCO 2 -eq.)
8.2 Topics on GHG Emissions …
277