

PyHasse, a Software Package for Applicational Studies of Partial Orderings
303
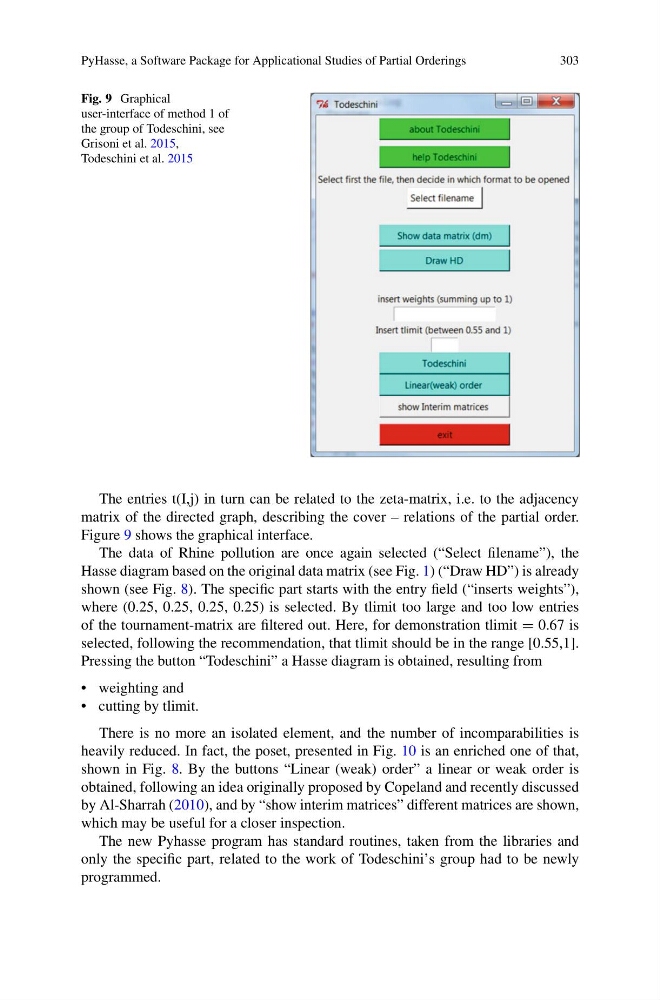
Fig. 9 Graphical
user-interface of method 1 of
the group of Todeschini, see
Grisoni et al. 2015,
Todeschini et al. 2015
The entries t(I,j) in turn can be related to the zeta-matrix, i.e. to the adjacency
matrix of the directed graph, describing the cover – relations of the partial order.
Figure 9 shows the graphical interface.
The data of Rhine pollution are once again selected (“Select filename”), the
Hasse diagram based on the original data matrix (see Fig. 1) (“Draw HD”) is already
shown (see Fig. 8). The specific part starts with the entry field (“inserts weights”),
where (0.25, 0.25, 0.25, 0.25) is selected. By tlimit too large and too low entries
of the tournament-matrix are filtered out. Here, for demonstration tlimit = 0.67 is
selected, following the recommendation, that tlimit should be in the range [0.55,1].
Pressing the button “Todeschini” a Hasse diagram is obtained, resulting from
• weighting and
• cutting by tlimit.
There is no more an isolated element, and the number of incomparabilities is
heavily reduced. In fact, the poset, presented in Fig. 10 is an enriched one of that,
shown in Fig. 8. By the buttons “Linear (weak) order” a linear or weak order is
obtained, following an idea originally proposed by Copeland and recently discussed
by Al-Sharrah (2010), and by “show interim matrices” different matrices are shown,
which may be useful for a closer inspection.
The new Pyhasse program has standard routines, taken from the libraries and
only the specific part, related to the work of Todeschini’s group had to be newly
programmed.
303
Fig. 9 Graphical
user-interface of method 1 of
the group of Todeschini, see
Grisoni et al. 2015,
Todeschini et al. 2015
The entries t(I,j) in turn can be related to the zeta-matrix, i.e. to the adjacency
matrix of the directed graph, describing the cover – relations of the partial order.
Figure 9 shows the graphical interface.
The data of Rhine pollution are once again selected (“Select filename”), the
Hasse diagram based on the original data matrix (see Fig. 1) (“Draw HD”) is already
shown (see Fig. 8). The specific part starts with the entry field (“inserts weights”),
where (0.25, 0.25, 0.25, 0.25) is selected. By tlimit too large and too low entries
of the tournament-matrix are filtered out. Here, for demonstration tlimit = 0.67 is
selected, following the recommendation, that tlimit should be in the range [0.55,1].
Pressing the button “Todeschini” a Hasse diagram is obtained, resulting from
• weighting and
• cutting by tlimit.
There is no more an isolated element, and the number of incomparabilities is
heavily reduced. In fact, the poset, presented in Fig. 10 is an enriched one of that,
shown in Fig. 8. By the buttons “Linear (weak) order” a linear or weak order is
obtained, following an idea originally proposed by Copeland and recently discussed
by Al-Sharrah (2010), and by “show interim matrices” different matrices are shown,
which may be useful for a closer inspection.
The new Pyhasse program has standard routines, taken from the libraries and
only the specific part, related to the work of Todeschini’s group had to be newly
programmed.