

302
R. Bruggemann et al.
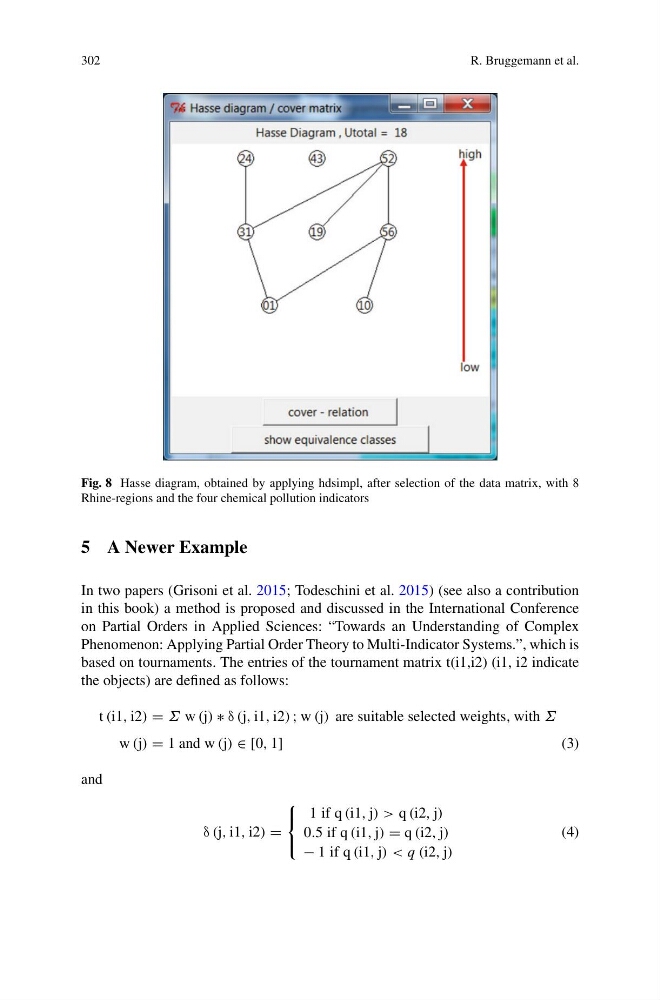
Fig. 8 Hasse diagram, obtained by applying hdsimpl, after selection of the data matrix, with 8
Rhine-regions and the four chemical pollution indicators
5 A Newer Example
In two papers (Grisoni et al. 2015; Todeschini et al. 2015) (see also a contribution
in this book) a method is proposed and discussed in the International Conference
on Partial Orders in Applied Sciences: “Towards an Understanding of Complex
Phenomenon: Applying Partial Order Theory to Multi-Indicator Systems.”, which is
based on tournaments. The entries of the tournament matrix t(i1,i2) (i1, i2 indicate
the objects) are defined as follows:
t (i1, i2) = Σ w (j) ∗ δ (j, i1, i2) ; w (j) are suitable selected weights, with Σ
w (j) = 1 and w (j) ∈ [0, 1]
(3)
and
δ (j, i1, i2) =
⎧
⎨
⎩
1 if q (i1, j) > q (i2, j)
0.5 if q (i1, j) = q (i2, j)
− 1 if q (i1, j) < q (i2, j)
(4)
R. Bruggemann et al.
Fig. 8 Hasse diagram, obtained by applying hdsimpl, after selection of the data matrix, with 8
Rhine-regions and the four chemical pollution indicators
5 A Newer Example
In two papers (Grisoni et al. 2015; Todeschini et al. 2015) (see also a contribution
in this book) a method is proposed and discussed in the International Conference
on Partial Orders in Applied Sciences: “Towards an Understanding of Complex
Phenomenon: Applying Partial Order Theory to Multi-Indicator Systems.”, which is
based on tournaments. The entries of the tournament matrix t(i1,i2) (i1, i2 indicate
the objects) are defined as follows:
t (i1, i2) = Σ w (j) ∗ δ (j, i1, i2) ; w (j) are suitable selected weights, with Σ
w (j) = 1 and w (j) ∈ [0, 1]
(3)
and
δ (j, i1, i2) =
⎧
⎨
⎩
1 if q (i1, j) > q (i2, j)
0.5 if q (i1, j) = q (i2, j)
− 1 if q (i1, j) < q (i2, j)
(4)