

238
M. Fattore and A. Arcagni
0000
1000
0100
1100
0010
1010
0110
1110
0001
1001
0101
1101
0011
1011
0111
1111
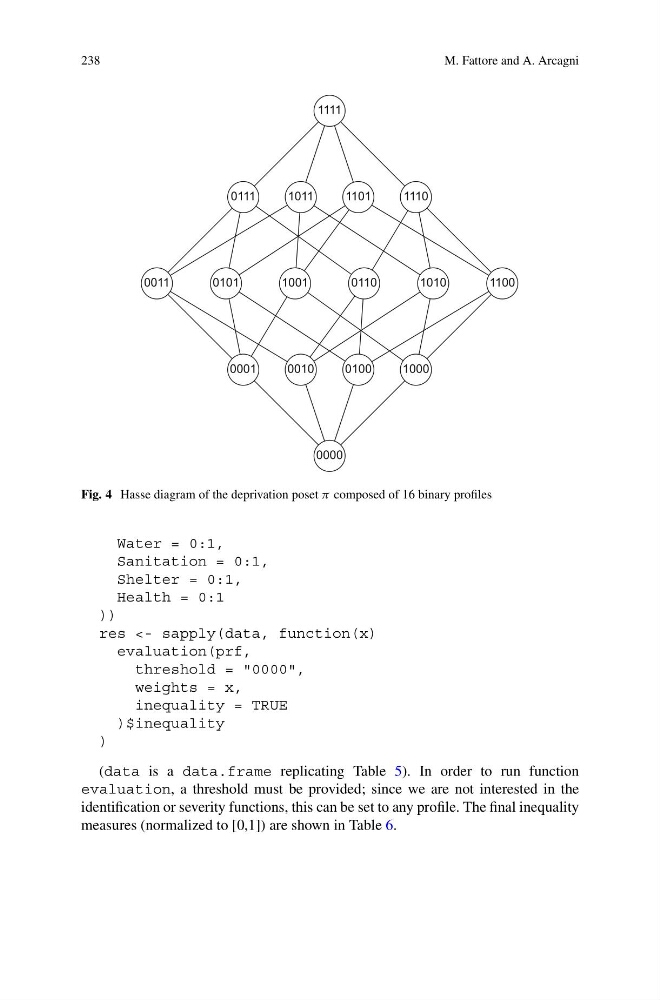
Fig. 4 Hasse diagram of the deprivation poset π composed of 16 binary profiles
Water = 0:1,
Sanitation = 0:1,
Shelter = 0:1,
Health = 0:1
))
res <- sapply(data, function(x)
evaluation(prf,
threshold = "0000",
weights = x,
inequality = TRUE
)$inequality
)
(data is a data.frame replicating Table 5). In order to run function
evaluation, a threshold must be provided; since we are not interested in the
identification or severity functions, this can be set to any profile. The final inequality
measures (normalized to [0,1]) are shown in Table 6.
M. Fattore and A. Arcagni
0000
1000
0100
1100
0010
1010
0110
1110
0001
1001
0101
1101
0011
1011
0111
1111
Fig. 4 Hasse diagram of the deprivation poset π composed of 16 binary profiles
Water = 0:1,
Sanitation = 0:1,
Shelter = 0:1,
Health = 0:1
))
res <- sapply(data, function(x)
evaluation(prf,
threshold = "0000",
weights = x,
inequality = TRUE
)$inequality
)
(data is a data.frame replicating Table 5). In order to run function
evaluation, a threshold must be provided; since we are not interested in the
identification or severity functions, this can be set to any profile. The final inequality
measures (normalized to [0,1]) are shown in Table 6.