

Posetic Tools in the Social Sciences: A Tutorial Exposition
237
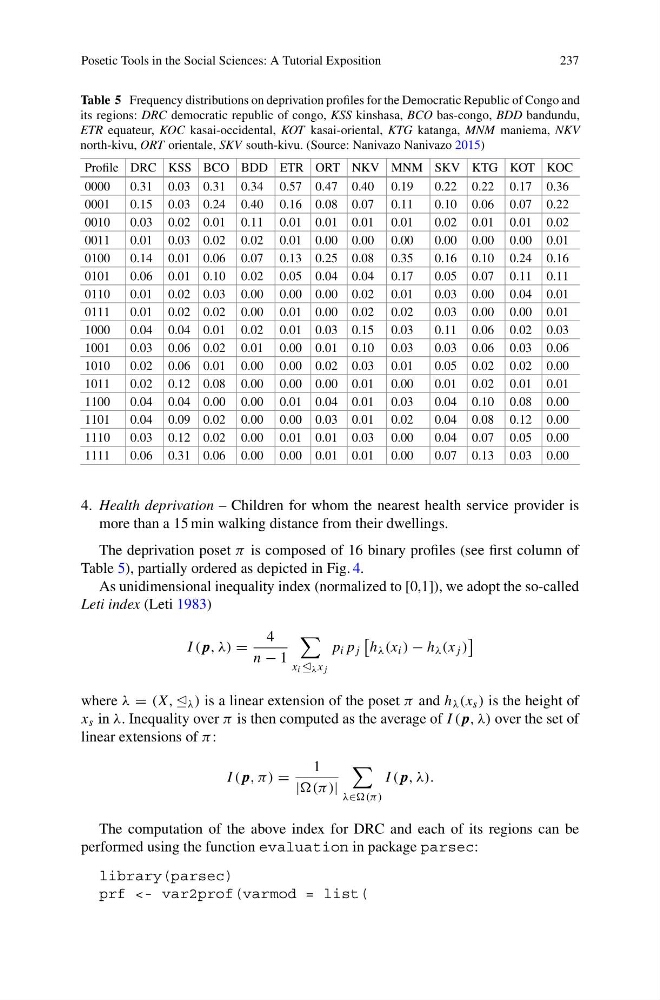
Table 5 Frequency distributions on deprivation profiles for the Democratic Republic of Congo and
its regions: DRC democratic republic of congo, KSS kinshasa, BCO bas-congo, BDD bandundu,
ETR equateur, KOC kasai-occidental, KOT kasai-oriental, KTG katanga, MNM maniema, NKV
north-kivu, ORT orientale, SKV south-kivu. (Source: Nanivazo Nanivazo 2015)
Profile DRC KSS BCO BDD ETR ORT NKV MNM SKV KTG KOT KOC
0000
0.31 0.03 0.31 0.34 0.57 0.47 0.40 0.19
0.22 0.22 0.17 0.36
0001
0.15 0.03 0.24 0.40 0.16 0.08 0.07 0.11
0.10 0.06 0.07 0.22
0010
0.03 0.02 0.01 0.11 0.01 0.01 0.01 0.01
0.02 0.01 0.01 0.02
0011
0.01 0.03 0.02 0.02 0.01 0.00 0.00 0.00
0.00 0.00 0.00 0.01
0100
0.14 0.01 0.06 0.07 0.13 0.25 0.08 0.35
0.16 0.10 0.24 0.16
0101
0.06 0.01 0.10 0.02 0.05 0.04 0.04 0.17
0.05 0.07 0.11 0.11
0110
0.01 0.02 0.03 0.00 0.00 0.00 0.02 0.01
0.03 0.00 0.04 0.01
0111
0.01 0.02 0.02 0.00 0.01 0.00 0.02 0.02
0.03 0.00 0.00 0.01
1000
0.04 0.04 0.01 0.02 0.01 0.03 0.15 0.03
0.11 0.06 0.02 0.03
1001
0.03 0.06 0.02 0.01 0.00 0.01 0.10 0.03
0.03 0.06 0.03 0.06
1010
0.02 0.06 0.01 0.00 0.00 0.02 0.03 0.01
0.05 0.02 0.02 0.00
1011
0.02 0.12 0.08 0.00 0.00 0.00 0.01 0.00
0.01 0.02 0.01 0.01
1100
0.04 0.04 0.00 0.00 0.01 0.04 0.01 0.03
0.04 0.10 0.08 0.00
1101
0.04 0.09 0.02 0.00 0.00 0.03 0.01 0.02
0.04 0.08 0.12 0.00
1110
0.03 0.12 0.02 0.00 0.01 0.01 0.03 0.00
0.04 0.07 0.05 0.00
1111
0.06 0.31 0.06 0.00 0.00 0.01 0.01 0.00
0.07 0.13 0.03 0.00
4. Health deprivation – Children for whom the nearest health service provider is
more than a 15 min walking distance from their dwellings.
The deprivation poset π is composed of 16 binary profiles (see first column of
Table 5), partially ordered as depicted in Fig. 4.
As unidimensional inequality index (normalized to [0,1]), we adopt the so-called
Leti index (Leti 1983)
I (p, λ) =
4
n − 1
x i λ x j
p i p j
h λ (x i ) − h λ (x j )
where λ = (X, λ ) is a linear extension of the poset π and h λ (x s ) is the height of
x s in λ. Inequality over π is then computed as the average of I (p, λ) over the set of
linear extensions of π :
I (p, π) =
1
|
λ∈
I (p, λ).
The computation of the above index for DRC and each of its regions can be
performed using the function evaluation in package parsec:
library(parsec)
prf <- var2prof(varmod = list(
237
Table 5 Frequency distributions on deprivation profiles for the Democratic Republic of Congo and
its regions: DRC democratic republic of congo, KSS kinshasa, BCO bas-congo, BDD bandundu,
ETR equateur, KOC kasai-occidental, KOT kasai-oriental, KTG katanga, MNM maniema, NKV
north-kivu, ORT orientale, SKV south-kivu. (Source: Nanivazo Nanivazo 2015)
Profile DRC KSS BCO BDD ETR ORT NKV MNM SKV KTG KOT KOC
0000
0.31 0.03 0.31 0.34 0.57 0.47 0.40 0.19
0.22 0.22 0.17 0.36
0001
0.15 0.03 0.24 0.40 0.16 0.08 0.07 0.11
0.10 0.06 0.07 0.22
0010
0.03 0.02 0.01 0.11 0.01 0.01 0.01 0.01
0.02 0.01 0.01 0.02
0011
0.01 0.03 0.02 0.02 0.01 0.00 0.00 0.00
0.00 0.00 0.00 0.01
0100
0.14 0.01 0.06 0.07 0.13 0.25 0.08 0.35
0.16 0.10 0.24 0.16
0101
0.06 0.01 0.10 0.02 0.05 0.04 0.04 0.17
0.05 0.07 0.11 0.11
0110
0.01 0.02 0.03 0.00 0.00 0.00 0.02 0.01
0.03 0.00 0.04 0.01
0111
0.01 0.02 0.02 0.00 0.01 0.00 0.02 0.02
0.03 0.00 0.00 0.01
1000
0.04 0.04 0.01 0.02 0.01 0.03 0.15 0.03
0.11 0.06 0.02 0.03
1001
0.03 0.06 0.02 0.01 0.00 0.01 0.10 0.03
0.03 0.06 0.03 0.06
1010
0.02 0.06 0.01 0.00 0.00 0.02 0.03 0.01
0.05 0.02 0.02 0.00
1011
0.02 0.12 0.08 0.00 0.00 0.00 0.01 0.00
0.01 0.02 0.01 0.01
1100
0.04 0.04 0.00 0.00 0.01 0.04 0.01 0.03
0.04 0.10 0.08 0.00
1101
0.04 0.09 0.02 0.00 0.00 0.03 0.01 0.02
0.04 0.08 0.12 0.00
1110
0.03 0.12 0.02 0.00 0.01 0.01 0.03 0.00
0.04 0.07 0.05 0.00
1111
0.06 0.31 0.06 0.00 0.00 0.01 0.01 0.00
0.07 0.13 0.03 0.00
4. Health deprivation – Children for whom the nearest health service provider is
more than a 15 min walking distance from their dwellings.
The deprivation poset π is composed of 16 binary profiles (see first column of
Table 5), partially ordered as depicted in Fig. 4.
As unidimensional inequality index (normalized to [0,1]), we adopt the so-called
Leti index (Leti 1983)
I (p, λ) =
4
n − 1
x i λ x j
p i p j
h λ (x i ) − h λ (x j )
where λ = (X, λ ) is a linear extension of the poset π and h λ (x s ) is the height of
x s in λ. Inequality over π is then computed as the average of I (p, λ) over the set of
linear extensions of π :
I (p, π) =
1
|
λ∈
I (p, λ).
The computation of the above index for DRC and each of its regions can be
performed using the function evaluation in package parsec:
library(parsec)
prf <- var2prof(varmod = list(