

234
M. Fattore and A. Arcagni
3.3.1 Real Example
We report here a simple example from the original paper (Fattore and Arcagni
2018), pertaining to the comparison of populations’ health. Data are taken from
The National Health Interview Survey 2010, held in Denmark. Following Hussain
et al. (2016), four binary dimensions of health are considered 4 and scored in binary
terms (1 – No health problem; 0 – Health problem) on five populations distinguished
by the educational attainment of the respondents (D 1 = Basic, D 2 = V ocational,
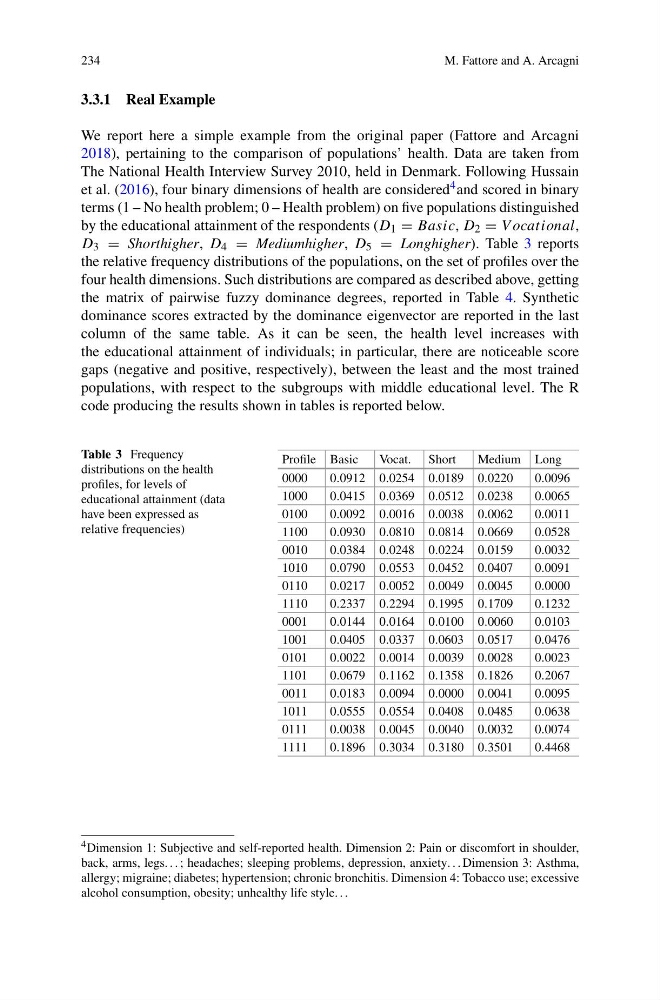
D 3 = Shorthigher, D 4 = Mediumhigher, D 5 = Longhigher). Table 3 reports
the relative frequency distributions of the populations, on the set of profiles over the
four health dimensions. Such distributions are compared as described above, getting
the matrix of pairwise fuzzy dominance degrees, reported in Table 4. Synthetic
dominance scores extracted by the dominance eigenvector are reported in the last
column of the same table. As it can be seen, the health level increases with
the educational attainment of individuals; in particular, there are noticeable score
gaps (negative and positive, respectively), between the least and the most trained
populations, with respect to the subgroups with middle educational level. The R
code producing the results shown in tables is reported below.
Table 3 Frequency
distributions on the health
profiles, for levels of
educational attainment (data
have been expressed as
relative frequencies)
Profile Basic
Vocat. Short
Medium Long
0000
0.0912 0.0254 0.0189 0.0220
0.0096
1000
0.0415 0.0369 0.0512 0.0238
0.0065
0100
0.0092 0.0016 0.0038 0.0062
0.0011
1100
0.0930 0.0810 0.0814 0.0669
0.0528
0010
0.0384 0.0248 0.0224 0.0159
0.0032
1010
0.0790 0.0553 0.0452 0.0407
0.0091
0110
0.0217 0.0052 0.0049 0.0045
0.0000
1110
0.2337 0.2294 0.1995 0.1709
0.1232
0001
0.0144 0.0164 0.0100 0.0060
0.0103
1001
0.0405 0.0337 0.0603 0.0517
0.0476
0101
0.0022 0.0014 0.0039 0.0028
0.0023
1101
0.0679 0.1162 0.1358 0.1826
0.2067
0011
0.0183 0.0094 0.0000 0.0041
0.0095
1011
0.0555 0.0554 0.0408 0.0485
0.0638
0111
0.0038 0.0045 0.0040 0.0032
0.0074
1111
0.1896 0.3034 0.3180 0.3501
0.4468
4 Dimension 1: Subjective and self-reported health. Dimension 2: Pain or discomfort in shoulder,
back, arms, legs. . . ; headaches; sleeping problems, depression, anxiety. . . Dimension 3: Asthma,
allergy; migraine; diabetes; hypertension; chronic bronchitis. Dimension 4: Tobacco use; excessive
alcohol consumption, obesity; unhealthy life style. . .
M. Fattore and A. Arcagni
3.3.1 Real Example
We report here a simple example from the original paper (Fattore and Arcagni
2018), pertaining to the comparison of populations’ health. Data are taken from
The National Health Interview Survey 2010, held in Denmark. Following Hussain
et al. (2016), four binary dimensions of health are considered 4 and scored in binary
terms (1 – No health problem; 0 – Health problem) on five populations distinguished
by the educational attainment of the respondents (D 1 = Basic, D 2 = V ocational,
D 3 = Shorthigher, D 4 = Mediumhigher, D 5 = Longhigher). Table 3 reports
the relative frequency distributions of the populations, on the set of profiles over the
four health dimensions. Such distributions are compared as described above, getting
the matrix of pairwise fuzzy dominance degrees, reported in Table 4. Synthetic
dominance scores extracted by the dominance eigenvector are reported in the last
column of the same table. As it can be seen, the health level increases with
the educational attainment of individuals; in particular, there are noticeable score
gaps (negative and positive, respectively), between the least and the most trained
populations, with respect to the subgroups with middle educational level. The R
code producing the results shown in tables is reported below.
Table 3 Frequency
distributions on the health
profiles, for levels of
educational attainment (data
have been expressed as
relative frequencies)
Profile Basic
Vocat. Short
Medium Long
0000
0.0912 0.0254 0.0189 0.0220
0.0096
1000
0.0415 0.0369 0.0512 0.0238
0.0065
0100
0.0092 0.0016 0.0038 0.0062
0.0011
1100
0.0930 0.0810 0.0814 0.0669
0.0528
0010
0.0384 0.0248 0.0224 0.0159
0.0032
1010
0.0790 0.0553 0.0452 0.0407
0.0091
0110
0.0217 0.0052 0.0049 0.0045
0.0000
1110
0.2337 0.2294 0.1995 0.1709
0.1232
0001
0.0144 0.0164 0.0100 0.0060
0.0103
1001
0.0405 0.0337 0.0603 0.0517
0.0476
0101
0.0022 0.0014 0.0039 0.0028
0.0023
1101
0.0679 0.1162 0.1358 0.1826
0.2067
0011
0.0183 0.0094 0.0000 0.0041
0.0095
1011
0.0555 0.0554 0.0408 0.0485
0.0638
0111
0.0038 0.0045 0.0040 0.0032
0.0074
1111
0.1896 0.3034 0.3180 0.3501
0.4468
4 Dimension 1: Subjective and self-reported health. Dimension 2: Pain or discomfort in shoulder,
back, arms, legs. . . ; headaches; sleeping problems, depression, anxiety. . . Dimension 3: Asthma,
allergy; migraine; diabetes; hypertension; chronic bronchitis. Dimension 4: Tobacco use; excessive
alcohol consumption, obesity; unhealthy life style. . .