

Posetic Tools in the Social Sciences: A Tutorial Exposition
233
0.0
0.2
0.4
0.6
0.8
1.0
0
200
400
600
Identification
Frequency
0.0
0.2
0.4
0.6
0.8
1.0
1000
2000
3000
4000
Identification
Cumulative frequency
0
5
10 15 20 25 30
0
200
400
600
Severity
Frequency
0
5
10 15 20 25 30
1000
2000
3000
4000
Severity
Cumulative frequency
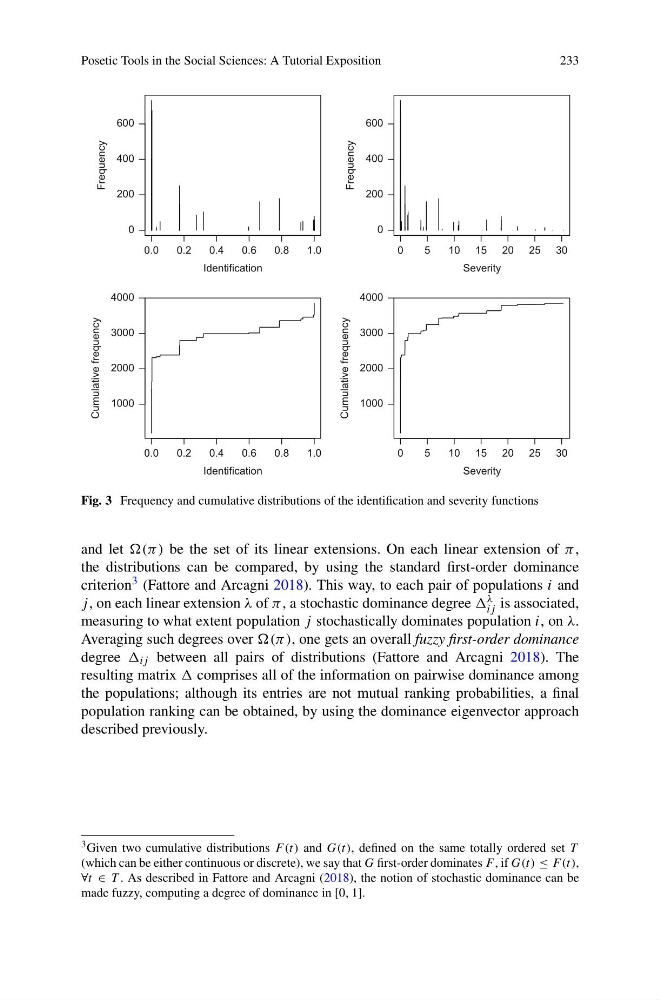
Fig. 3 Frequency and cumulative distributions of the identification and severity functions
and let be the set of its linear extensions. On each linear extension of π ,
the distributions can be compared, by using the standard first-order dominance
criterion 3 (Fattore and Arcagni 2018). This way, to each pair of populations i and
j , on each linear extension λ of π , a stochastic dominance degree λ
ij is associated,
measuring to what extent population j stochastically dominates population i, on λ.
Averaging such degrees over one gets an overall fuzzy first-order dominance
degree ij between all pairs of distributions (Fattore and Arcagni 2018). The
resulting matrix comprises all of the information on pairwise dominance among
the populations; although its entries are not mutual ranking probabilities, a final
population ranking can be obtained, by using the dominance eigenvector approach
described previously.
3 Given two cumulative distributions F (t) and G(t), defined on the same totally ordered set T
(which can be either continuous or discrete), we say that G first-order dominates F , if G(t) ≤ F (t),
∀t ∈ T . As described in Fattore and Arcagni (2018), the notion of stochastic dominance can be
made fuzzy, computing a degree of dominance in [0, 1].
233
0.0
0.2
0.4
0.6
0.8
1.0
0
200
400
600
Identification
Frequency
0.0
0.2
0.4
0.6
0.8
1.0
1000
2000
3000
4000
Identification
Cumulative frequency
0
5
10 15 20 25 30
0
200
400
600
Severity
Frequency
0
5
10 15 20 25 30
1000
2000
3000
4000
Severity
Cumulative frequency
Fig. 3 Frequency and cumulative distributions of the identification and severity functions
and let be the set of its linear extensions. On each linear extension of π ,
the distributions can be compared, by using the standard first-order dominance
criterion 3 (Fattore and Arcagni 2018). This way, to each pair of populations i and
j , on each linear extension λ of π , a stochastic dominance degree λ
ij is associated,
measuring to what extent population j stochastically dominates population i, on λ.
Averaging such degrees over one gets an overall fuzzy first-order dominance
degree ij between all pairs of distributions (Fattore and Arcagni 2018). The
resulting matrix comprises all of the information on pairwise dominance among
the populations; although its entries are not mutual ranking probabilities, a final
population ranking can be obtained, by using the dominance eigenvector approach
described previously.
3 Given two cumulative distributions F (t) and G(t), defined on the same totally ordered set T
(which can be either continuous or discrete), we say that G first-order dominates F , if G(t) ≤ F (t),
∀t ∈ T . As described in Fattore and Arcagni (2018), the notion of stochastic dominance can be
made fuzzy, computing a degree of dominance in [0, 1].