

Posetic Tools in the Social Sciences: A Tutorial Exposition
235
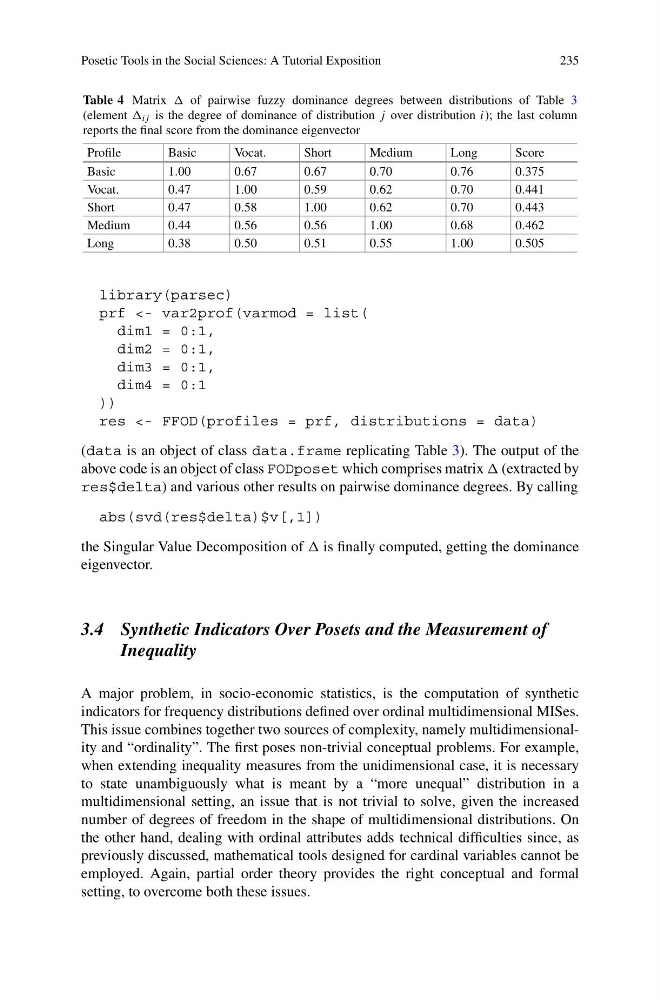
Table 4 Matrix of pairwise fuzzy dominance degrees between distributions of Table 3
(element ij is the degree of dominance of distribution j over distribution i); the last column
reports the final score from the dominance eigenvector
Profile
Basic
Vocat.
Short
Medium
Long
Score
Basic
1.00
0.67
0.67
0.70
0.76
0.375
Vocat.
0.47
1.00
0.59
0.62
0.70
0.441
Short
0.47
0.58
1.00
0.62
0.70
0.443
Medium
0.44
0.56
0.56
1.00
0.68
0.462
Long
0.38
0.50
0.51
0.55
1.00
0.505
library(parsec)
prf <- var2prof(varmod = list(
dim1 = 0:1,
dim2 = 0:1,
dim3 = 0:1,
dim4 = 0:1
))
res <- FFOD(profiles = prf, distributions = data)
(data is an object of class data.frame replicating Table 3). The output of the
above code is an object of class FODposet which comprises matrix (extracted by
res$delta) and various other results on pairwise dominance degrees. By calling
abs(svd(res$delta)$v[,1])
the Singular Value Decomposition of is finally computed, getting the dominance
eigenvector.
3.4 Synthetic Indicators Over Posets and the Measurement of
Inequality
A major problem, in socio-economic statistics, is the computation of synthetic
indicators for frequency distributions defined over ordinal multidimensional MISes.
This issue combines together two sources of complexity, namely multidimensionality and “ordinality”. The first poses non-trivial conceptual problems. For example,
when extending inequality measures from the unidimensional case, it is necessary
to state unambiguously what is meant by a “more unequal” distribution in a
multidimensional setting, an issue that is not trivial to solve, given the increased
number of degrees of freedom in the shape of multidimensional distributions. On
the other hand, dealing with ordinal attributes adds technical difficulties since, as
previously discussed, mathematical tools designed for cardinal variables cannot be
employed. Again, partial order theory provides the right conceptual and formal
setting, to overcome both these issues.
235
Table 4 Matrix of pairwise fuzzy dominance degrees between distributions of Table 3
(element ij is the degree of dominance of distribution j over distribution i); the last column
reports the final score from the dominance eigenvector
Profile
Basic
Vocat.
Short
Medium
Long
Score
Basic
1.00
0.67
0.67
0.70
0.76
0.375
Vocat.
0.47
1.00
0.59
0.62
0.70
0.441
Short
0.47
0.58
1.00
0.62
0.70
0.443
Medium
0.44
0.56
0.56
1.00
0.68
0.462
Long
0.38
0.50
0.51
0.55
1.00
0.505
library(parsec)
prf <- var2prof(varmod = list(
dim1 = 0:1,
dim2 = 0:1,
dim3 = 0:1,
dim4 = 0:1
))
res <- FFOD(profiles = prf, distributions = data)
(data is an object of class data.frame replicating Table 3). The output of the
above code is an object of class FODposet which comprises matrix (extracted by
res$delta) and various other results on pairwise dominance degrees. By calling
abs(svd(res$delta)$v[,1])
the Singular Value Decomposition of is finally computed, getting the dominance
eigenvector.
3.4 Synthetic Indicators Over Posets and the Measurement of
Inequality
A major problem, in socio-economic statistics, is the computation of synthetic
indicators for frequency distributions defined over ordinal multidimensional MISes.
This issue combines together two sources of complexity, namely multidimensionality and “ordinality”. The first poses non-trivial conceptual problems. For example,
when extending inequality measures from the unidimensional case, it is necessary
to state unambiguously what is meant by a “more unequal” distribution in a
multidimensional setting, an issue that is not trivial to solve, given the increased
number of degrees of freedom in the shape of multidimensional distributions. On
the other hand, dealing with ordinal attributes adds technical difficulties since, as
previously discussed, mathematical tools designed for cardinal variables cannot be
employed. Again, partial order theory provides the right conceptual and formal
setting, to overcome both these issues.