

Posetic Tools in the Social Sciences: A Tutorial Exposition
227
AT
BE
BU
HR
CY
CZ
DK
EE
FI
FR
DE
GR
HU
IE
IT
LV
LT
LU
MT
NL
PO
PT
RO
SK
SI
ES
SE
UK
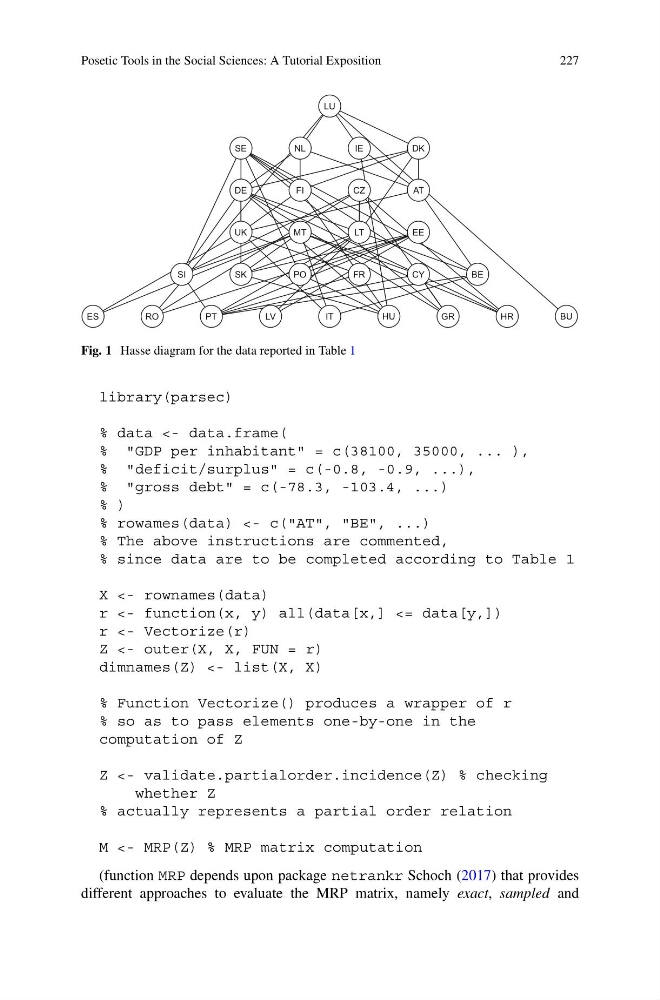
Fig. 1 Hasse diagram for the data reported in Table 1
library(parsec)
% data <- data.frame(
% "GDP per inhabitant" = c(38100, 35000, ... ),
% "deficit/surplus" = c(-0.8, -0.9, ...),
% "gross debt" = c(-78.3, -103.4, ...)
% )
% rowames(data) <- c("AT", "BE", ...)
% The above instructions are commented,
% since data are to be completed according to Table 1
X <- rownames(data)
r <- function(x, y) all(data[x,] <= data[y,])
r <- Vectorize(r)
Z <- outer(X, X, FUN = r)
dimnames(Z) <- list(X, X)
% Function Vectorize() produces a wrapper of r
% so as to pass elements one-by-one in the
computation of Z
Z <- validate.partialorder.incidence(Z) % checking
whether Z
% actually represents a partial order relation
M <- MRP(Z) % MRP matrix computation
(function MRP depends upon package netrankr Schoch (2017) that provides
different approaches to evaluate the MRP matrix, namely exact, sampled and
227
AT
BE
BU
HR
CY
CZ
DK
EE
FI
FR
DE
GR
HU
IE
IT
LV
LT
LU
MT
NL
PO
PT
RO
SK
SI
ES
SE
UK
Fig. 1 Hasse diagram for the data reported in Table 1
library(parsec)
% data <- data.frame(
% "GDP per inhabitant" = c(38100, 35000, ... ),
% "deficit/surplus" = c(-0.8, -0.9, ...),
% "gross debt" = c(-78.3, -103.4, ...)
% )
% rowames(data) <- c("AT", "BE", ...)
% The above instructions are commented,
% since data are to be completed according to Table 1
X <- rownames(data)
r <- function(x, y) all(data[x,] <= data[y,])
r <- Vectorize(r)
Z <- outer(X, X, FUN = r)
dimnames(Z) <- list(X, X)
% Function Vectorize() produces a wrapper of r
% so as to pass elements one-by-one in the
computation of Z
Z <- validate.partialorder.incidence(Z) % checking
whether Z
% actually represents a partial order relation
M <- MRP(Z) % MRP matrix computation
(function MRP depends upon package netrankr Schoch (2017) that provides
different approaches to evaluate the MRP matrix, namely exact, sampled and