

226
M. Fattore and A. Arcagni
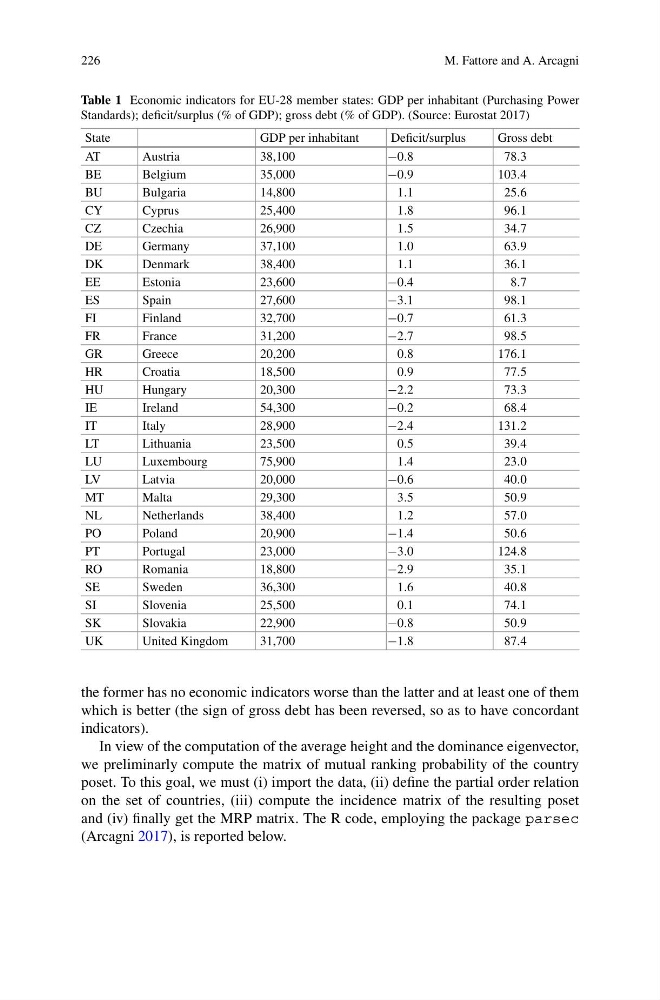
Table 1 Economic indicators for EU-28 member states: GDP per inhabitant (Purchasing Power
Standards); deficit/surplus (% of GDP); gross debt (% of GDP). (Source: Eurostat 2017)
State
GDP per inhabitant
Deficit/surplus
Gross debt
AT
Austria
38,100
−0.8
78.3
BE
Belgium
35,000
−0.9
103.4
BU
Bulgaria
14,800
1.1
25.6
CY
Cyprus
25,400
1.8
96.1
CZ
Czechia
26,900
1.5
34.7
DE
Germany
37,100
1.0
63.9
DK
Denmark
38,400
1.1
36.1
EE
Estonia
23,600
−0.4
8.7
ES
Spain
27,600
−3.1
98.1
FI
Finland
32,700
−0.7
61.3
FR
France
31,200
−2.7
98.5
GR
Greece
20,200
0.8
176.1
HR
Croatia
18,500
0.9
77.5
HU
Hungary
20,300
−2.2
73.3
IE
Ireland
54,300
−0.2
68.4
IT
Italy
28,900
−2.4
131.2
LT
Lithuania
23,500
0.5
39.4
LU
Luxembourg
75,900
1.4
23.0
LV
Latvia
20,000
−0.6
40.0
MT
Malta
29,300
3.5
50.9
NL
Netherlands
38,400
1.2
57.0
PO
Poland
20,900
−1.4
50.6
PT
Portugal
23,000
−3.0
124.8
RO
Romania
18,800
−2.9
35.1
SE
Sweden
36,300
1.6
40.8
SI
Slovenia
25,500
0.1
74.1
SK
Slovakia
22,900
−0.8
50.9
UK
United Kingdom
31,700
−1.8
87.4
the former has no economic indicators worse than the latter and at least one of them
which is better (the sign of gross debt has been reversed, so as to have concordant
indicators).
In view of the computation of the average height and the dominance eigenvector,
we preliminarly compute the matrix of mutual ranking probability of the country
poset. To this goal, we must (i) import the data, (ii) define the partial order relation
on the set of countries, (iii) compute the incidence matrix of the resulting poset
and (iv) finally get the MRP matrix. The R code, employing the package parsec
(Arcagni 2017), is reported below.
M. Fattore and A. Arcagni
Table 1 Economic indicators for EU-28 member states: GDP per inhabitant (Purchasing Power
Standards); deficit/surplus (% of GDP); gross debt (% of GDP). (Source: Eurostat 2017)
State
GDP per inhabitant
Deficit/surplus
Gross debt
AT
Austria
38,100
−0.8
78.3
BE
Belgium
35,000
−0.9
103.4
BU
Bulgaria
14,800
1.1
25.6
CY
Cyprus
25,400
1.8
96.1
CZ
Czechia
26,900
1.5
34.7
DE
Germany
37,100
1.0
63.9
DK
Denmark
38,400
1.1
36.1
EE
Estonia
23,600
−0.4
8.7
ES
Spain
27,600
−3.1
98.1
FI
Finland
32,700
−0.7
61.3
FR
France
31,200
−2.7
98.5
GR
Greece
20,200
0.8
176.1
HR
Croatia
18,500
0.9
77.5
HU
Hungary
20,300
−2.2
73.3
IE
Ireland
54,300
−0.2
68.4
IT
Italy
28,900
−2.4
131.2
LT
Lithuania
23,500
0.5
39.4
LU
Luxembourg
75,900
1.4
23.0
LV
Latvia
20,000
−0.6
40.0
MT
Malta
29,300
3.5
50.9
NL
Netherlands
38,400
1.2
57.0
PO
Poland
20,900
−1.4
50.6
PT
Portugal
23,000
−3.0
124.8
RO
Romania
18,800
−2.9
35.1
SE
Sweden
36,300
1.6
40.8
SI
Slovenia
25,500
0.1
74.1
SK
Slovakia
22,900
−0.8
50.9
UK
United Kingdom
31,700
−1.8
87.4
the former has no economic indicators worse than the latter and at least one of them
which is better (the sign of gross debt has been reversed, so as to have concordant
indicators).
In view of the computation of the average height and the dominance eigenvector,
we preliminarly compute the matrix of mutual ranking probability of the country
poset. To this goal, we must (i) import the data, (ii) define the partial order relation
on the set of countries, (iii) compute the incidence matrix of the resulting poset
and (iv) finally get the MRP matrix. The R code, employing the package parsec
(Arcagni 2017), is reported below.