

There Is No Such Thing as a Free Lunch! Who Is Paying for Our Happiness?
211
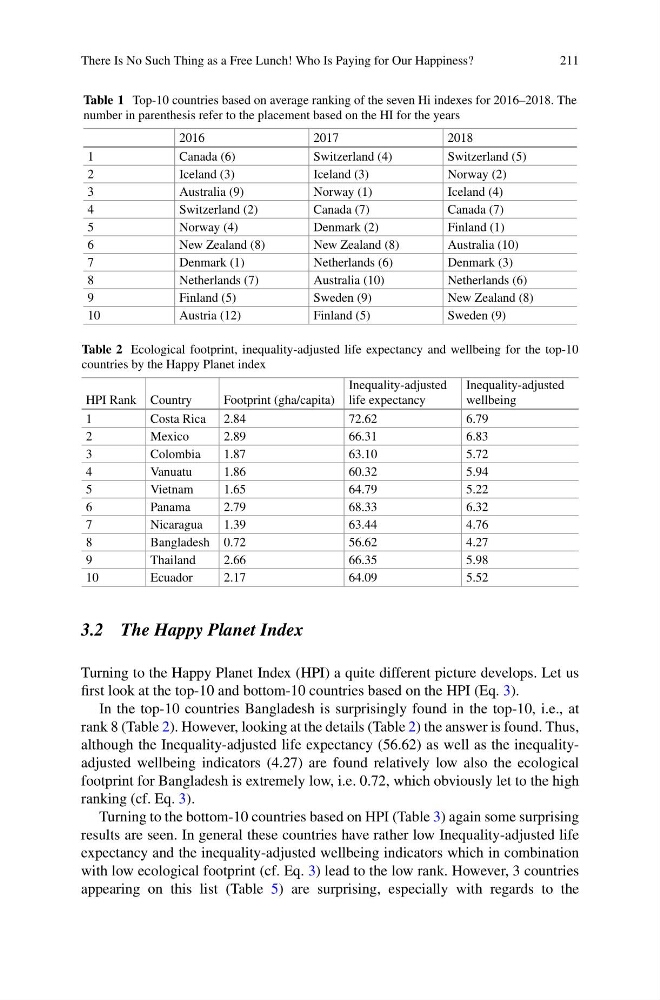
Table 1 Top-10 countries based on average ranking of the seven Hi indexes for 2016–2018. The
number in parenthesis refer to the placement based on the HI for the years
2016
2017
2018
1
Canada (6)
Switzerland (4)
Switzerland (5)
2
Iceland (3)
Iceland (3)
Norway (2)
3
Australia (9)
Norway (1)
Iceland (4)
4
Switzerland (2)
Canada (7)
Canada (7)
5
Norway (4)
Denmark (2)
Finland (1)
6
New Zealand (8)
New Zealand (8)
Australia (10)
7
Denmark (1)
Netherlands (6)
Denmark (3)
8
Netherlands (7)
Australia (10)
Netherlands (6)
9
Finland (5)
Sweden (9)
New Zealand (8)
10
Austria (12)
Finland (5)
Sweden (9)
Table 2 Ecological footprint, inequality-adjusted life expectancy and wellbeing for the top-10
countries by the Happy Planet index
HPI Rank Country
Footprint (gha/capita)
Inequality-adjusted
life expectancy
Inequality-adjusted
wellbeing
1
Costa Rica 2.84
72.62
6.79
2
Mexico
2.89
66.31
6.83
3
Colombia
1.87
63.10
5.72
4
Vanuatu
1.86
60.32
5.94
5
Vietnam
1.65
64.79
5.22
6
Panama
2.79
68.33
6.32
7
Nicaragua
1.39
63.44
4.76
8
Bangladesh 0.72
56.62
4.27
9
Thailand
2.66
66.35
5.98
10
Ecuador
2.17
64.09
5.52
3.2 The Happy Planet Index
Turning to the Happy Planet Index (HPI) a quite different picture develops. Let us
first look at the top-10 and bottom-10 countries based on the HPI (Eq. 3).
In the top-10 countries Bangladesh is surprisingly found in the top-10, i.e., at
rank 8 (Table 2). However, looking at the details (Table 2) the answer is found. Thus,
although the Inequality-adjusted life expectancy (56.62) as well as the inequalityadjusted wellbeing indicators (4.27) are found relatively low also the ecological
footprint for Bangladesh is extremely low, i.e. 0.72, which obviously let to the high
ranking (cf. Eq. 3).
Turning to the bottom-10 countries based on HPI (Table 3) again some surprising
results are seen. In general these countries have rather low Inequality-adjusted life
expectancy and the inequality-adjusted wellbeing indicators which in combination
with low ecological footprint (cf. Eq. 3) lead to the low rank. However, 3 countries
appearing on this list (Table 5) are surprising, especially with regards to the
211
Table 1 Top-10 countries based on average ranking of the seven Hi indexes for 2016–2018. The
number in parenthesis refer to the placement based on the HI for the years
2016
2017
2018
1
Canada (6)
Switzerland (4)
Switzerland (5)
2
Iceland (3)
Iceland (3)
Norway (2)
3
Australia (9)
Norway (1)
Iceland (4)
4
Switzerland (2)
Canada (7)
Canada (7)
5
Norway (4)
Denmark (2)
Finland (1)
6
New Zealand (8)
New Zealand (8)
Australia (10)
7
Denmark (1)
Netherlands (6)
Denmark (3)
8
Netherlands (7)
Australia (10)
Netherlands (6)
9
Finland (5)
Sweden (9)
New Zealand (8)
10
Austria (12)
Finland (5)
Sweden (9)
Table 2 Ecological footprint, inequality-adjusted life expectancy and wellbeing for the top-10
countries by the Happy Planet index
HPI Rank Country
Footprint (gha/capita)
Inequality-adjusted
life expectancy
Inequality-adjusted
wellbeing
1
Costa Rica 2.84
72.62
6.79
2
Mexico
2.89
66.31
6.83
3
Colombia
1.87
63.10
5.72
4
Vanuatu
1.86
60.32
5.94
5
Vietnam
1.65
64.79
5.22
6
Panama
2.79
68.33
6.32
7
Nicaragua
1.39
63.44
4.76
8
Bangladesh 0.72
56.62
4.27
9
Thailand
2.66
66.35
5.98
10
Ecuador
2.17
64.09
5.52
3.2 The Happy Planet Index
Turning to the Happy Planet Index (HPI) a quite different picture develops. Let us
first look at the top-10 and bottom-10 countries based on the HPI (Eq. 3).
In the top-10 countries Bangladesh is surprisingly found in the top-10, i.e., at
rank 8 (Table 2). However, looking at the details (Table 2) the answer is found. Thus,
although the Inequality-adjusted life expectancy (56.62) as well as the inequalityadjusted wellbeing indicators (4.27) are found relatively low also the ecological
footprint for Bangladesh is extremely low, i.e. 0.72, which obviously let to the high
ranking (cf. Eq. 3).
Turning to the bottom-10 countries based on HPI (Table 3) again some surprising
results are seen. In general these countries have rather low Inequality-adjusted life
expectancy and the inequality-adjusted wellbeing indicators which in combination
with low ecological footprint (cf. Eq. 3) lead to the low rank. However, 3 countries
appearing on this list (Table 5) are surprising, especially with regards to the