

210
L. Carlsen
1.15
0.92
0.69
0.46
0.23
0 1 2 3 4 5 6
0:=GPD
1:=SocSup
2:=LifeExp
3:=FreeCho
4:=Gener
5:=PerCor
6:=Dys
sensitivity
10^3
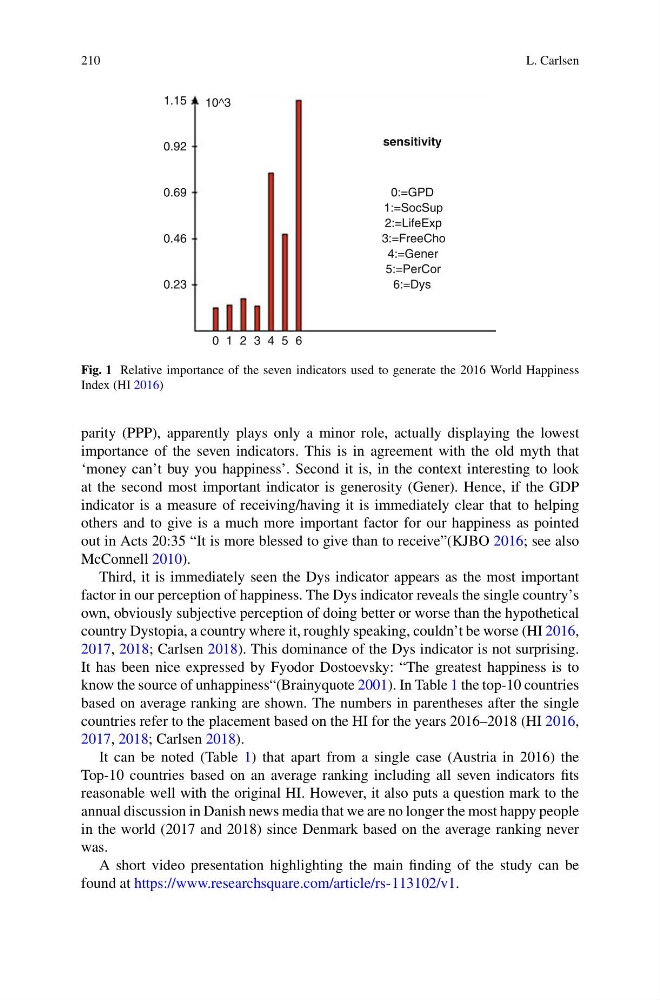
Fig. 1 Relative importance of the seven indicators used to generate the 2016 World Happiness
Index (HI 2016)
parity (PPP), apparently plays only a minor role, actually displaying the lowest
importance of the seven indicators. This is in agreement with the old myth that
‘money can’t buy you happiness’. Second it is, in the context interesting to look
at the second most important indicator is generosity (Gener). Hence, if the GDP
indicator is a measure of receiving/having it is immediately clear that to helping
others and to give is a much more important factor for our happiness as pointed
out in Acts 20:35 “It is more blessed to give than to receive”(KJBO 2016; see also
McConnell 2010).
Third, it is immediately seen the Dys indicator appears as the most important
factor in our perception of happiness. The Dys indicator reveals the single country’s
own, obviously subjective perception of doing better or worse than the hypothetical
country Dystopia, a country where it, roughly speaking, couldn’t be worse (HI 2016,
2017, 2018; Carlsen 2018). This dominance of the Dys indicator is not surprising.
It has been nice expressed by Fyodor Dostoevsky: “The greatest happiness is to
know the source of unhappiness“(Brainyquote 2001). In Table 1 the top-10 countries
based on average ranking are shown. The numbers in parentheses after the single
countries refer to the placement based on the HI for the years 2016–2018 (HI 2016,
2017, 2018; Carlsen 2018).
It can be noted (Table 1) that apart from a single case (Austria in 2016) the
Top-10 countries based on an average ranking including all seven indicators fits
reasonable well with the original HI. However, it also puts a question mark to the
annual discussion in Danish news media that we are no longer the most happy people
in the world (2017 and 2018) since Denmark based on the average ranking never
was.
A short video presentation highlighting the main finding of the study can be
found at https://www.researchsquare.com/article/rs-113102/v1.
L. Carlsen
1.15
0.92
0.69
0.46
0.23
0 1 2 3 4 5 6
0:=GPD
1:=SocSup
2:=LifeExp
3:=FreeCho
4:=Gener
5:=PerCor
6:=Dys
sensitivity
10^3
Fig. 1 Relative importance of the seven indicators used to generate the 2016 World Happiness
Index (HI 2016)
parity (PPP), apparently plays only a minor role, actually displaying the lowest
importance of the seven indicators. This is in agreement with the old myth that
‘money can’t buy you happiness’. Second it is, in the context interesting to look
at the second most important indicator is generosity (Gener). Hence, if the GDP
indicator is a measure of receiving/having it is immediately clear that to helping
others and to give is a much more important factor for our happiness as pointed
out in Acts 20:35 “It is more blessed to give than to receive”(KJBO 2016; see also
McConnell 2010).
Third, it is immediately seen the Dys indicator appears as the most important
factor in our perception of happiness. The Dys indicator reveals the single country’s
own, obviously subjective perception of doing better or worse than the hypothetical
country Dystopia, a country where it, roughly speaking, couldn’t be worse (HI 2016,
2017, 2018; Carlsen 2018). This dominance of the Dys indicator is not surprising.
It has been nice expressed by Fyodor Dostoevsky: “The greatest happiness is to
know the source of unhappiness“(Brainyquote 2001). In Table 1 the top-10 countries
based on average ranking are shown. The numbers in parentheses after the single
countries refer to the placement based on the HI for the years 2016–2018 (HI 2016,
2017, 2018; Carlsen 2018).
It can be noted (Table 1) that apart from a single case (Austria in 2016) the
Top-10 countries based on an average ranking including all seven indicators fits
reasonable well with the original HI. However, it also puts a question mark to the
annual discussion in Danish news media that we are no longer the most happy people
in the world (2017 and 2018) since Denmark based on the average ranking never
was.
A short video presentation highlighting the main finding of the study can be
found at https://www.researchsquare.com/article/rs-113102/v1.