

212
L. Carlsen
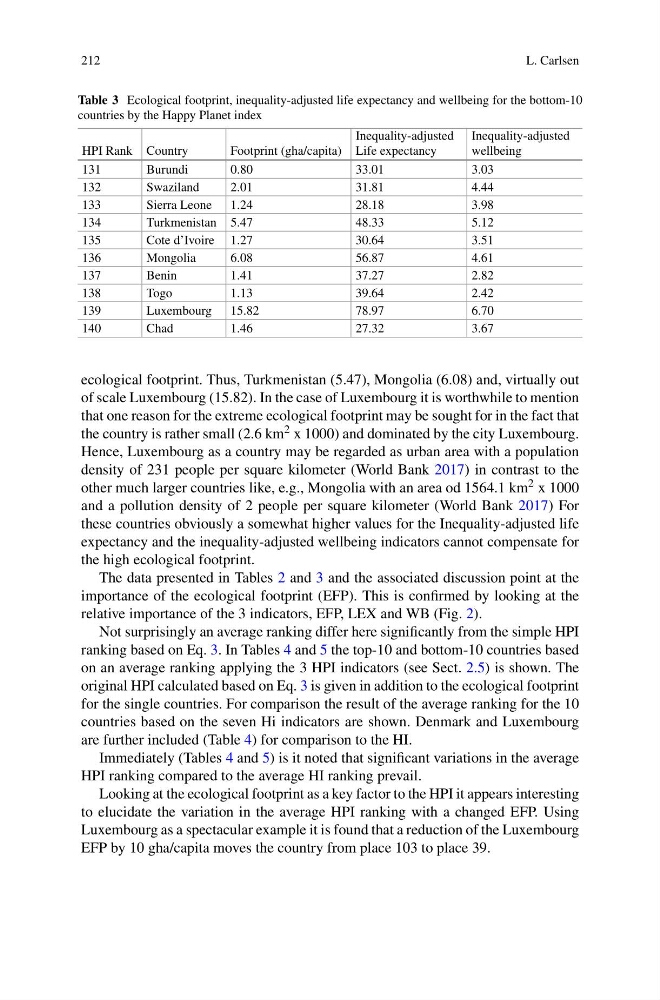
Table 3 Ecological footprint, inequality-adjusted life expectancy and wellbeing for the bottom-10
countries by the Happy Planet index
HPI Rank Country
Footprint (gha/capita)
Inequality-adjusted
Life expectancy
Inequality-adjusted
wellbeing
131
Burundi
0.80
33.01
3.03
132
Swaziland
2.01
31.81
4.44
133
Sierra Leone 1.24
28.18
3.98
134
Turkmenistan 5.47
48.33
5.12
135
Cote d’Ivoire 1.27
30.64
3.51
136
Mongolia
6.08
56.87
4.61
137
Benin
1.41
37.27
2.82
138
Togo
1.13
39.64
2.42
139
Luxembourg 15.82
78.97
6.70
140
Chad
1.46
27.32
3.67
ecological footprint. Thus, Turkmenistan (5.47), Mongolia (6.08) and, virtually out
of scale Luxembourg (15.82). In the case of Luxembourg it is worthwhile to mention
that one reason for the extreme ecological footprint may be sought for in the fact that
the country is rather small (2.6 km 2 x 1000) and dominated by the city Luxembourg.
Hence, Luxembourg as a country may be regarded as urban area with a population
density of 231 people per square kilometer (World Bank 2017) in contrast to the
other much larger countries like, e.g., Mongolia with an area od 1564.1 km 2 x 1000
and a pollution density of 2 people per square kilometer (World Bank 2017) For
these countries obviously a somewhat higher values for the Inequality-adjusted life
expectancy and the inequality-adjusted wellbeing indicators cannot compensate for
the high ecological footprint.
The data presented in Tables 2 and 3 and the associated discussion point at the
importance of the ecological footprint (EFP). This is confirmed by looking at the
relative importance of the 3 indicators, EFP, LEX and WB (Fig. 2).
Not surprisingly an average ranking differ here significantly from the simple HPI
ranking based on Eq. 3. In Tables 4 and 5 the top-10 and bottom-10 countries based
on an average ranking applying the 3 HPI indicators (see Sect. 2.5) is shown. The
original HPI calculated based on Eq. 3 is given in addition to the ecological footprint
for the single countries. For comparison the result of the average ranking for the 10
countries based on the seven Hi indicators are shown. Denmark and Luxembourg
are further included (Table 4) for comparison to the HI.
Immediately (Tables 4 and 5) is it noted that significant variations in the average
HPI ranking compared to the average HI ranking prevail.
Looking at the ecological footprint as a key factor to the HPI it appears interesting
to elucidate the variation in the average HPI ranking with a changed EFP. Using
Luxembourg as a spectacular example it is found that a reduction of the Luxembourg
EFP by 10 gha/capita moves the country from place 103 to place 39.
L. Carlsen
Table 3 Ecological footprint, inequality-adjusted life expectancy and wellbeing for the bottom-10
countries by the Happy Planet index
HPI Rank Country
Footprint (gha/capita)
Inequality-adjusted
Life expectancy
Inequality-adjusted
wellbeing
131
Burundi
0.80
33.01
3.03
132
Swaziland
2.01
31.81
4.44
133
Sierra Leone 1.24
28.18
3.98
134
Turkmenistan 5.47
48.33
5.12
135
Cote d’Ivoire 1.27
30.64
3.51
136
Mongolia
6.08
56.87
4.61
137
Benin
1.41
37.27
2.82
138
Togo
1.13
39.64
2.42
139
Luxembourg 15.82
78.97
6.70
140
Chad
1.46
27.32
3.67
ecological footprint. Thus, Turkmenistan (5.47), Mongolia (6.08) and, virtually out
of scale Luxembourg (15.82). In the case of Luxembourg it is worthwhile to mention
that one reason for the extreme ecological footprint may be sought for in the fact that
the country is rather small (2.6 km 2 x 1000) and dominated by the city Luxembourg.
Hence, Luxembourg as a country may be regarded as urban area with a population
density of 231 people per square kilometer (World Bank 2017) in contrast to the
other much larger countries like, e.g., Mongolia with an area od 1564.1 km 2 x 1000
and a pollution density of 2 people per square kilometer (World Bank 2017) For
these countries obviously a somewhat higher values for the Inequality-adjusted life
expectancy and the inequality-adjusted wellbeing indicators cannot compensate for
the high ecological footprint.
The data presented in Tables 2 and 3 and the associated discussion point at the
importance of the ecological footprint (EFP). This is confirmed by looking at the
relative importance of the 3 indicators, EFP, LEX and WB (Fig. 2).
Not surprisingly an average ranking differ here significantly from the simple HPI
ranking based on Eq. 3. In Tables 4 and 5 the top-10 and bottom-10 countries based
on an average ranking applying the 3 HPI indicators (see Sect. 2.5) is shown. The
original HPI calculated based on Eq. 3 is given in addition to the ecological footprint
for the single countries. For comparison the result of the average ranking for the 10
countries based on the seven Hi indicators are shown. Denmark and Luxembourg
are further included (Table 4) for comparison to the HI.
Immediately (Tables 4 and 5) is it noted that significant variations in the average
HPI ranking compared to the average HI ranking prevail.
Looking at the ecological footprint as a key factor to the HPI it appears interesting
to elucidate the variation in the average HPI ranking with a changed EFP. Using
Luxembourg as a spectacular example it is found that a reduction of the Luxembourg
EFP by 10 gha/capita moves the country from place 103 to place 39.