

Comparison of Selected Procedures for Generating Activated Carbon. . .
173
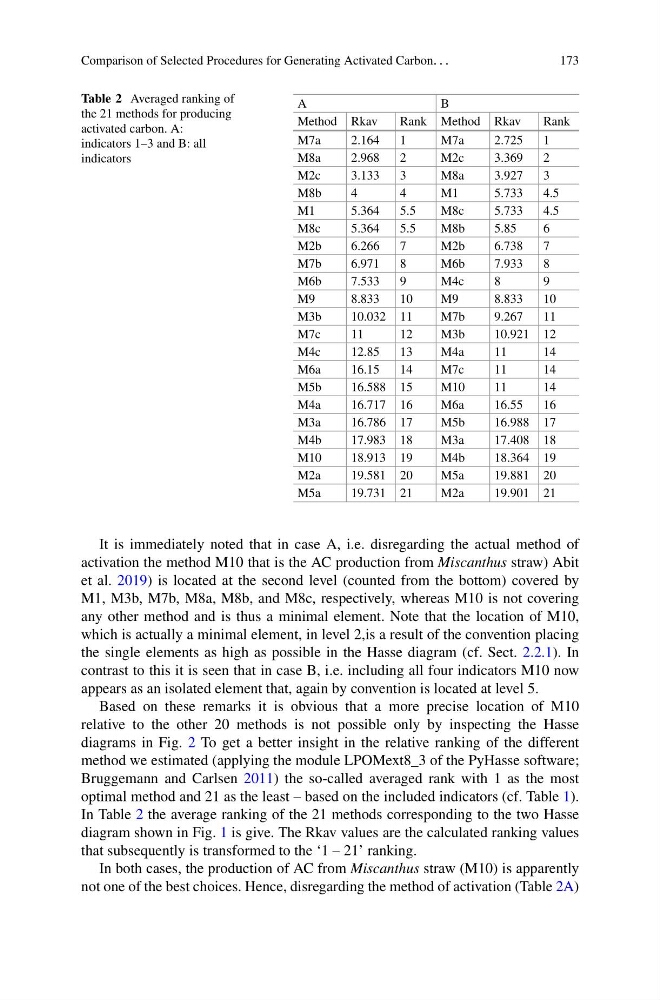
Table 2 Averaged ranking of
the 21 methods for producing
activated carbon. A:
indicators 1–3 and B: all
indicators
A
B
Method Rkav
Rank Method Rkav
Rank
M7a
2.164
1
M7a
2.725
1
M8a
2.968
2
M2c
3.369
2
M2c
3.133
3
M8a
3.927
3
M8b
4
4
M1
5.733
4.5
M1
5.364
5.5
M8c
5.733
4.5
M8c
5.364
5.5
M8b
5.85
6
M2b
6.266
7
M2b
6.738
7
M7b
6.971
8
M6b
7.933
8
M6b
7.533
9
M4c
8
9
M9
8.833
10
M9
8.833
10
M3b
10.032 11
M7b
9.267
11
M7c
11
12
M3b
10.921 12
M4c
12.85
13
M4a
11
14
M6a
16.15
14
M7c
11
14
M5b
16.588 15
M10
11
14
M4a
16.717 16
M6a
16.55
16
M3a
16.786 17
M5b
16.988 17
M4b
17.983 18
M3a
17.408 18
M10
18.913 19
M4b
18.364 19
M2a
19.581 20
M5a
19.881 20
M5a
19.731 21
M2a
19.901 21
It is immediately noted that in case A, i.e. disregarding the actual method of
activation the method M10 that is the AC production from Miscanthus straw) Abit
et al. 2019) is located at the second level (counted from the bottom) covered by
M1, M3b, M7b, M8a, M8b, and M8c, respectively, whereas M10 is not covering
any other method and is thus a minimal element. Note that the location of M10,
which is actually a minimal element, in level 2,is a result of the convention placing
the single elements as high as possible in the Hasse diagram (cf. Sect. 2.2.1). In
contrast to this it is seen that in case B, i.e. including all four indicators M10 now
appears as an isolated element that, again by convention is located at level 5.
Based on these remarks it is obvious that a more precise location of M10
relative to the other 20 methods is not possible only by inspecting the Hasse
diagrams in Fig. 2 To get a better insight in the relative ranking of the different
method we estimated (applying the module LPOMext8_3 of the PyHasse software;
Bruggemann and Carlsen 2011) the so-called averaged rank with 1 as the most
optimal method and 21 as the least – based on the included indicators (cf. Table 1).
In Table 2 the average ranking of the 21 methods corresponding to the two Hasse
diagram shown in Fig. 1 is give. The Rkav values are the calculated ranking values
that subsequently is transformed to the ‘1 – 21’ ranking.
In both cases, the production of AC from Miscanthus straw (M10) is apparently
not one of the best choices. Hence, disregarding the method of activation (Table 2A)
173
Table 2 Averaged ranking of
the 21 methods for producing
activated carbon. A:
indicators 1–3 and B: all
indicators
A
B
Method Rkav
Rank Method Rkav
Rank
M7a
2.164
1
M7a
2.725
1
M8a
2.968
2
M2c
3.369
2
M2c
3.133
3
M8a
3.927
3
M8b
4
4
M1
5.733
4.5
M1
5.364
5.5
M8c
5.733
4.5
M8c
5.364
5.5
M8b
5.85
6
M2b
6.266
7
M2b
6.738
7
M7b
6.971
8
M6b
7.933
8
M6b
7.533
9
M4c
8
9
M9
8.833
10
M9
8.833
10
M3b
10.032 11
M7b
9.267
11
M7c
11
12
M3b
10.921 12
M4c
12.85
13
M4a
11
14
M6a
16.15
14
M7c
11
14
M5b
16.588 15
M10
11
14
M4a
16.717 16
M6a
16.55
16
M3a
16.786 17
M5b
16.988 17
M4b
17.983 18
M3a
17.408 18
M10
18.913 19
M4b
18.364 19
M2a
19.581 20
M5a
19.881 20
M5a
19.731 21
M2a
19.901 21
It is immediately noted that in case A, i.e. disregarding the actual method of
activation the method M10 that is the AC production from Miscanthus straw) Abit
et al. 2019) is located at the second level (counted from the bottom) covered by
M1, M3b, M7b, M8a, M8b, and M8c, respectively, whereas M10 is not covering
any other method and is thus a minimal element. Note that the location of M10,
which is actually a minimal element, in level 2,is a result of the convention placing
the single elements as high as possible in the Hasse diagram (cf. Sect. 2.2.1). In
contrast to this it is seen that in case B, i.e. including all four indicators M10 now
appears as an isolated element that, again by convention is located at level 5.
Based on these remarks it is obvious that a more precise location of M10
relative to the other 20 methods is not possible only by inspecting the Hasse
diagrams in Fig. 2 To get a better insight in the relative ranking of the different
method we estimated (applying the module LPOMext8_3 of the PyHasse software;
Bruggemann and Carlsen 2011) the so-called averaged rank with 1 as the most
optimal method and 21 as the least – based on the included indicators (cf. Table 1).
In Table 2 the average ranking of the 21 methods corresponding to the two Hasse
diagram shown in Fig. 1 is give. The Rkav values are the calculated ranking values
that subsequently is transformed to the ‘1 – 21’ ranking.
In both cases, the production of AC from Miscanthus straw (M10) is apparently
not one of the best choices. Hence, disregarding the method of activation (Table 2A)