

174
L. Carlsen and K. Abit
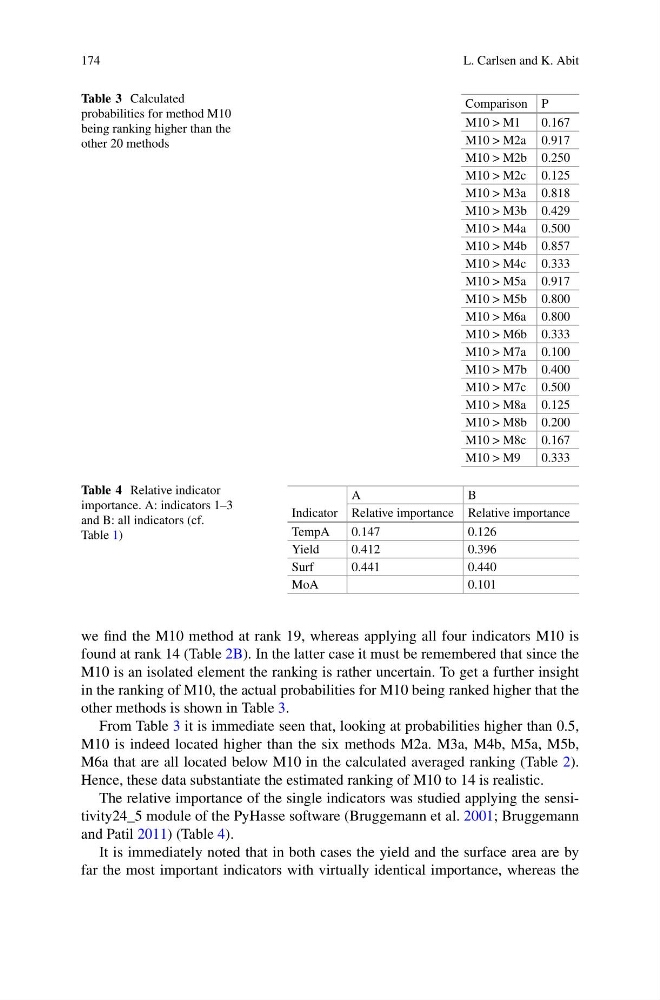
Table 3 Calculated
probabilities for method M10
being ranking higher than the
other 20 methods
Comparison P
M10 > M1
0.167
M10 > M2a 0.917
M10 > M2b 0.250
M10 > M2c 0.125
M10 > M3a 0.818
M10 > M3b 0.429
M10 > M4a 0.500
M10 > M4b 0.857
M10 > M4c 0.333
M10 > M5a 0.917
M10 > M5b 0.800
M10 > M6a 0.800
M10 > M6b 0.333
M10 > M7a 0.100
M10 > M7b 0.400
M10 > M7c 0.500
M10 > M8a 0.125
M10 > M8b 0.200
M10 > M8c 0.167
M10 > M9
0.333
Table 4 Relative indicator
importance. A: indicators 1–3
and B: all indicators (cf.
Table 1)
A
B
Indicator Relative importance Relative importance
TempA
0.147
0.126
Yield
0.412
0.396
Surf
0.441
0.440
MoA
0.101
we find the M10 method at rank 19, whereas applying all four indicators M10 is
found at rank 14 (Table 2B). In the latter case it must be remembered that since the
M10 is an isolated element the ranking is rather uncertain. To get a further insight
in the ranking of M10, the actual probabilities for M10 being ranked higher that the
other methods is shown in Table 3.
From Table 3 it is immediate seen that, looking at probabilities higher than 0.5,
M10 is indeed located higher than the six methods M2a. M3a, M4b, M5a, M5b,
M6a that are all located below M10 in the calculated averaged ranking (Table 2).
Hence, these data substantiate the estimated ranking of M10 to 14 is realistic.
The relative importance of the single indicators was studied applying the sensitivity24_5 module of the PyHasse software (Bruggemann et al. 2001; Bruggemann
and Patil 2011) (Table 4).
It is immediately noted that in both cases the yield and the surface area are by
far the most important indicators with virtually identical importance, whereas the
L. Carlsen and K. Abit
Table 3 Calculated
probabilities for method M10
being ranking higher than the
other 20 methods
Comparison P
M10 > M1
0.167
M10 > M2a 0.917
M10 > M2b 0.250
M10 > M2c 0.125
M10 > M3a 0.818
M10 > M3b 0.429
M10 > M4a 0.500
M10 > M4b 0.857
M10 > M4c 0.333
M10 > M5a 0.917
M10 > M5b 0.800
M10 > M6a 0.800
M10 > M6b 0.333
M10 > M7a 0.100
M10 > M7b 0.400
M10 > M7c 0.500
M10 > M8a 0.125
M10 > M8b 0.200
M10 > M8c 0.167
M10 > M9
0.333
Table 4 Relative indicator
importance. A: indicators 1–3
and B: all indicators (cf.
Table 1)
A
B
Indicator Relative importance Relative importance
TempA
0.147
0.126
Yield
0.412
0.396
Surf
0.441
0.440
MoA
0.101
we find the M10 method at rank 19, whereas applying all four indicators M10 is
found at rank 14 (Table 2B). In the latter case it must be remembered that since the
M10 is an isolated element the ranking is rather uncertain. To get a further insight
in the ranking of M10, the actual probabilities for M10 being ranked higher that the
other methods is shown in Table 3.
From Table 3 it is immediate seen that, looking at probabilities higher than 0.5,
M10 is indeed located higher than the six methods M2a. M3a, M4b, M5a, M5b,
M6a that are all located below M10 in the calculated averaged ranking (Table 2).
Hence, these data substantiate the estimated ranking of M10 to 14 is realistic.
The relative importance of the single indicators was studied applying the sensitivity24_5 module of the PyHasse software (Bruggemann et al. 2001; Bruggemann
and Patil 2011) (Table 4).
It is immediately noted that in both cases the yield and the surface area are by
far the most important indicators with virtually identical importance, whereas the