

172
L. Carlsen and K. Abit
Fig. 1 Example of a tripartite graph
a
b
M1
M2c
M4c
M2b
M6b
M7b
M6a
M5b
M4b
M4a
M3b
M3a
M5a
M2a
M2a
M10
M7a M7c M8a M8b M8c
M9
M1 M2c
M2b
M6b
M7b
M4a M4c M7a M7c M8a M8b M8c M9 M10
M6a
M5b
M4b
M3b
M3a
M5a
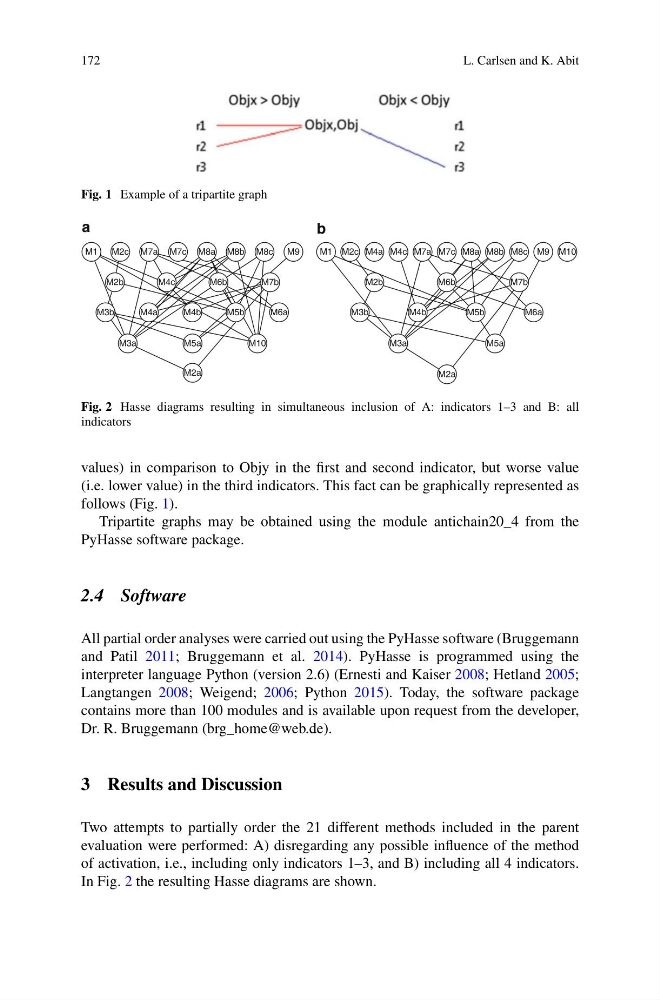
Fig. 2 Hasse diagrams resulting in simultaneous inclusion of A: indicators 1–3 and B: all
indicators
values) in comparison to Objy in the first and second indicator, but worse value
(i.e. lower value) in the third indicators. This fact can be graphically represented as
follows (Fig. 1).
Tripartite graphs may be obtained using the module antichain20_4 from the
PyHasse software package.
2.4 Software
All partial order analyses were carried out using the PyHasse software (Bruggemann
and Patil 2011; Bruggemann et al. 2014). PyHasse is programmed using the
interpreter language Python (version 2.6) (Ernesti and Kaiser 2008; Hetland 2005;
Langtangen 2008; Weigend; 2006; Python 2015). Today, the software package
contains more than 100 modules and is available upon request from the developer,
Dr. R. Bruggemann (brg_home@web.de).
3 Results and Discussion
Two attempts to partially order the 21 different methods included in the parent
evaluation were performed: A) disregarding any possible influence of the method
of activation, i.e., including only indicators 1–3, and B) including all 4 indicators.
In Fig. 2 the resulting Hasse diagrams are shown.
L. Carlsen and K. Abit
Fig. 1 Example of a tripartite graph
a
b
M1
M2c
M4c
M2b
M6b
M7b
M6a
M5b
M4b
M4a
M3b
M3a
M5a
M2a
M2a
M10
M7a M7c M8a M8b M8c
M9
M1 M2c
M2b
M6b
M7b
M4a M4c M7a M7c M8a M8b M8c M9 M10
M6a
M5b
M4b
M3b
M3a
M5a
Fig. 2 Hasse diagrams resulting in simultaneous inclusion of A: indicators 1–3 and B: all
indicators
values) in comparison to Objy in the first and second indicator, but worse value
(i.e. lower value) in the third indicators. This fact can be graphically represented as
follows (Fig. 1).
Tripartite graphs may be obtained using the module antichain20_4 from the
PyHasse software package.
2.4 Software
All partial order analyses were carried out using the PyHasse software (Bruggemann
and Patil 2011; Bruggemann et al. 2014). PyHasse is programmed using the
interpreter language Python (version 2.6) (Ernesti and Kaiser 2008; Hetland 2005;
Langtangen 2008; Weigend; 2006; Python 2015). Today, the software package
contains more than 100 modules and is available upon request from the developer,
Dr. R. Bruggemann (brg_home@web.de).
3 Results and Discussion
Two attempts to partially order the 21 different methods included in the parent
evaluation were performed: A) disregarding any possible influence of the method
of activation, i.e., including only indicators 1–3, and B) including all 4 indicators.
In Fig. 2 the resulting Hasse diagrams are shown.