

148
B. Panahbehagh and R. Bruggemann
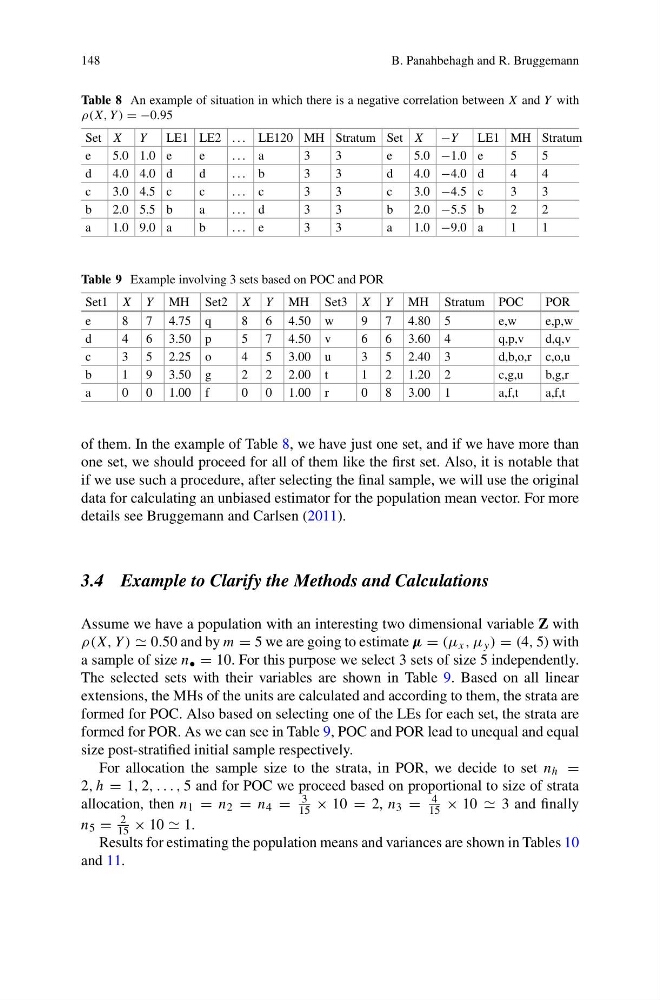
Table 8 An example of situation in which there is a negative correlation between X and Y with
ρ(X, Y ) = −0.95
Set X Y
LE1 LE2 . . . LE120 MH Stratum Set X −Y
LE1 MH Stratum
e
5.0 1.0 e
e
. . . a
3
3
e
5.0 −1.0 e
5
5
d
4.0 4.0 d
d
. . . b
3
3
d
4.0 −4.0 d
4
4
c
3.0 4.5 c
c
. . . c
3
3
c
3.0 −4.5 c
3
3
b
2.0 5.5 b
a
. . . d
3
3
b
2.0 −5.5 b
2
2
a
1.0 9.0 a
b
. . . e
3
3
a
1.0 −9.0 a
1
1
Table 9 Example involving 3 sets based on POC and POR
Set1 X Y MH Set2 X Y MH Set3 X Y MH Stratum POC
POR
e
8 7 4.75 q
8 6 4.50 w
9 7 4.80 5
e,w
e,p,w
d
4 6 3.50 p
5 7 4.50 v
6 6 3.60 4
q,p,v
d,q,v
c
3 5 2.25 o
4 5 3.00 u
3 5 2.40 3
d,b,o,r c,o,u
b
1 9 3.50 g
2 2 2.00 t
1 2 1.20 2
c,g,u
b,g,r
a
0 0 1.00 f
0 0 1.00 r
0 8 3.00 1
a,f,t
a,f,t
of them. In the example of Table 8, we have just one set, and if we have more than
one set, we should proceed for all of them like the first set. Also, it is notable that
if we use such a procedure, after selecting the final sample, we will use the original
data for calculating an unbiased estimator for the population mean vector. For more
details see Bruggemann and Carlsen (2011).
3.4 Example to Clarify the Methods and Calculations
Assume we have a population with an interesting two dimensional variable Z with
ρ(X, Y ) 0.50 and by m = 5 we are going to estimate µ = (μ x , μ y ) = (4, 5) with
a sample of size n • = 10. For this purpose we select 3 sets of size 5 independently.
The selected sets with their variables are shown in Table 9. Based on all linear
extensions, the MHs of the units are calculated and according to them, the strata are
formed for POC. Also based on selecting one of the LEs for each set, the strata are
formed for POR. As we can see in Table 9, POC and POR lead to unequal and equal
size post-stratified initial sample respectively.
For allocation the sample size to the strata, in POR, we decide to set n h =
2, h = 1, 2, . . . , 5 and for POC we proceed based on proportional to size of strata
allocation, then n 1 = n 2 = n 4 =
3
15 × 10 = 2, n 3 =
4
15 × 10 3 and finally
n 5 =
2
15 × 10 1.
Results for estimating the population means and variances are shown in Tables 10
and 11.
B. Panahbehagh and R. Bruggemann
Table 8 An example of situation in which there is a negative correlation between X and Y with
ρ(X, Y ) = −0.95
Set X Y
LE1 LE2 . . . LE120 MH Stratum Set X −Y
LE1 MH Stratum
e
5.0 1.0 e
e
. . . a
3
3
e
5.0 −1.0 e
5
5
d
4.0 4.0 d
d
. . . b
3
3
d
4.0 −4.0 d
4
4
c
3.0 4.5 c
c
. . . c
3
3
c
3.0 −4.5 c
3
3
b
2.0 5.5 b
a
. . . d
3
3
b
2.0 −5.5 b
2
2
a
1.0 9.0 a
b
. . . e
3
3
a
1.0 −9.0 a
1
1
Table 9 Example involving 3 sets based on POC and POR
Set1 X Y MH Set2 X Y MH Set3 X Y MH Stratum POC
POR
e
8 7 4.75 q
8 6 4.50 w
9 7 4.80 5
e,w
e,p,w
d
4 6 3.50 p
5 7 4.50 v
6 6 3.60 4
q,p,v
d,q,v
c
3 5 2.25 o
4 5 3.00 u
3 5 2.40 3
d,b,o,r c,o,u
b
1 9 3.50 g
2 2 2.00 t
1 2 1.20 2
c,g,u
b,g,r
a
0 0 1.00 f
0 0 1.00 r
0 8 3.00 1
a,f,t
a,f,t
of them. In the example of Table 8, we have just one set, and if we have more than
one set, we should proceed for all of them like the first set. Also, it is notable that
if we use such a procedure, after selecting the final sample, we will use the original
data for calculating an unbiased estimator for the population mean vector. For more
details see Bruggemann and Carlsen (2011).
3.4 Example to Clarify the Methods and Calculations
Assume we have a population with an interesting two dimensional variable Z with
ρ(X, Y ) 0.50 and by m = 5 we are going to estimate µ = (μ x , μ y ) = (4, 5) with
a sample of size n • = 10. For this purpose we select 3 sets of size 5 independently.
The selected sets with their variables are shown in Table 9. Based on all linear
extensions, the MHs of the units are calculated and according to them, the strata are
formed for POC. Also based on selecting one of the LEs for each set, the strata are
formed for POR. As we can see in Table 9, POC and POR lead to unequal and equal
size post-stratified initial sample respectively.
For allocation the sample size to the strata, in POR, we decide to set n h =
2, h = 1, 2, . . . , 5 and for POC we proceed based on proportional to size of strata
allocation, then n 1 = n 2 = n 4 =
3
15 × 10 = 2, n 3 =
4
15 × 10 3 and finally
n 5 =
2
15 × 10 1.
Results for estimating the population means and variances are shown in Tables 10
and 11.