

144
B. Panahbehagh and R. Bruggemann
and if we assume that X and Y are linked by a linear regression model:
Y i = μ y + ρ x,y
σ y
σ x
(X i − μ x ) + ε i
where ε is a random variable independent from X, then
V ( μ y.MVSR ) =
1
dm
(σ
2
y −
(1 −
d
K )
m
ρ
2
x,y
m
h=1
(μ y(h) − μ y )
2 ),
which shows that MVSR is an efficient designs for estimating the population mean
for the main variable and efficiency of the other variable is dependent upon its
correlations with the main one. Then MVSR just consider one of the variables. In
the next subsection, based on partial order set theory (Poset), we will show that, it
is easy to present a strategy to consider all the variables simultaneously.
3.3 Ranked Set Sampling Based on Poset
First briefly we introduce Poset and Linear Extensions (LE).
3.3.1 Poset, Linear Extensions, and Hasse Diagram
The application of partial order set theory for ranking has been described by
Bruggemann and Carlsen (2011). In this theory, we have a set containing m units
each of them with R variables, with a binary relation between the units. To compare
two units of the set, if all variables of the first unit are equal or bigger (smaller) than
the second one, then the first unit is better (≥) (worse (<)) than the second one,
otherwise the two units are not comparable. Linear extensions (LEs) are different
projections of the partial order into a complete order that respect all the relations
in the partial order set. I.e. linear extensions are the result of order preserving
mappings. Therefore a relation a < b in a Poset is preserved in all linear extensions.
Also, a Hasse diagram is a graphical representation of the relation of units of a Poset
with an implied upward orientation. A point is drawn for each unit of the Poset and
joined with the line segment according to the following rules:
• If a < b in the Poset, then the point corresponding to a appears lower in the
drawing than the point corresponding to b.
• The two points a and b will be joined by line segment iff a < b or b < a and
there is no other element, z for which is a < z < b or b < z < a.
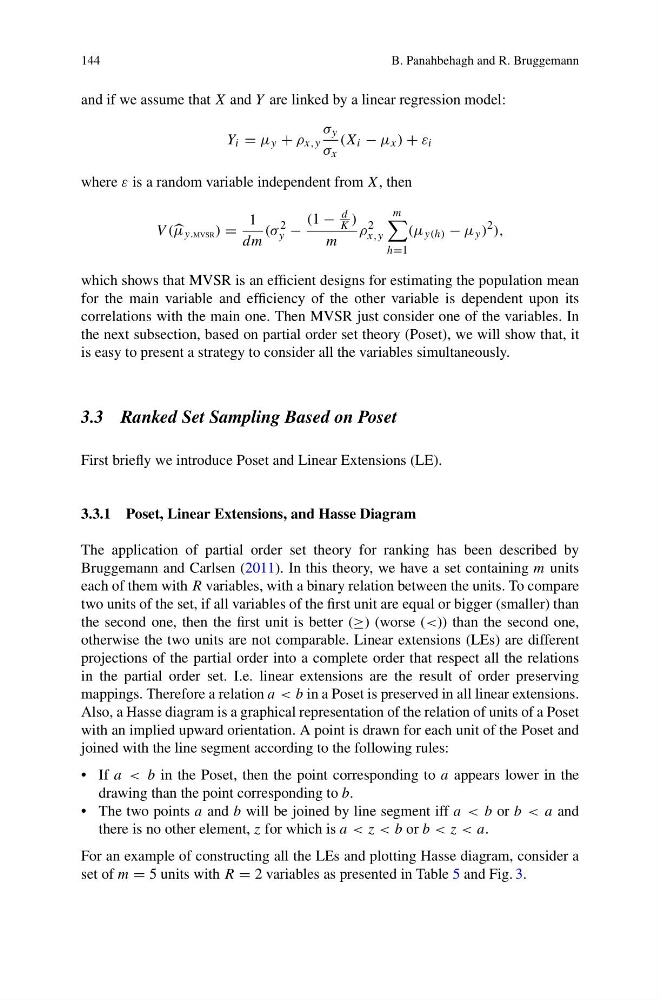
For an example of constructing all the LEs and plotting Hasse diagram, consider a
set of m = 5 units with R = 2 variables as presented in Table 5 and Fig. 3.
B. Panahbehagh and R. Bruggemann
and if we assume that X and Y are linked by a linear regression model:
Y i = μ y + ρ x,y
σ y
σ x
(X i − μ x ) + ε i
where ε is a random variable independent from X, then
V ( μ y.MVSR ) =
1
dm
(σ
2
y −
(1 −
d
K )
m
ρ
2
x,y
m
h=1
(μ y(h) − μ y )
2 ),
which shows that MVSR is an efficient designs for estimating the population mean
for the main variable and efficiency of the other variable is dependent upon its
correlations with the main one. Then MVSR just consider one of the variables. In
the next subsection, based on partial order set theory (Poset), we will show that, it
is easy to present a strategy to consider all the variables simultaneously.
3.3 Ranked Set Sampling Based on Poset
First briefly we introduce Poset and Linear Extensions (LE).
3.3.1 Poset, Linear Extensions, and Hasse Diagram
The application of partial order set theory for ranking has been described by
Bruggemann and Carlsen (2011). In this theory, we have a set containing m units
each of them with R variables, with a binary relation between the units. To compare
two units of the set, if all variables of the first unit are equal or bigger (smaller) than
the second one, then the first unit is better (≥) (worse (<)) than the second one,
otherwise the two units are not comparable. Linear extensions (LEs) are different
projections of the partial order into a complete order that respect all the relations
in the partial order set. I.e. linear extensions are the result of order preserving
mappings. Therefore a relation a < b in a Poset is preserved in all linear extensions.
Also, a Hasse diagram is a graphical representation of the relation of units of a Poset
with an implied upward orientation. A point is drawn for each unit of the Poset and
joined with the line segment according to the following rules:
• If a < b in the Poset, then the point corresponding to a appears lower in the
drawing than the point corresponding to b.
• The two points a and b will be joined by line segment iff a < b or b < a and
there is no other element, z for which is a < z < b or b < z < a.
For an example of constructing all the LEs and plotting Hasse diagram, consider a
set of m = 5 units with R = 2 variables as presented in Table 5 and Fig. 3.