

124
G. Al-Sharrah and H. M. S. Lababidi
3.3 Non-linear
Y 1 =
γ 1 X 1
1 + γ 2 X 2
+ ε 1
(4)
3.4 Complex
Y 1 = δ 1 e
−δ 2 X 1 (1 − δ 3 X 2 ) + ε 1
(5)
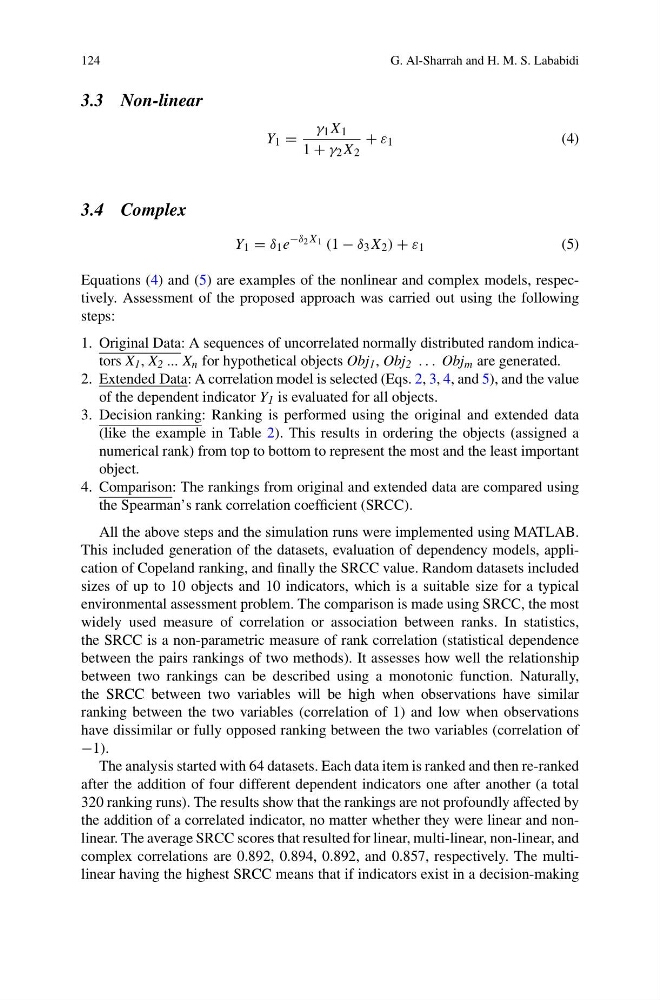
Equations (4) and (5) are examples of the nonlinear and complex models, respectively. Assessment of the proposed approach was carried out using the following
steps:
1. Original Data: A sequences of uncorrelated normally distributed random indicators X 1 , X 2 ... X n for hypothetical objects Obj 1 , Obj 2 . . . Obj m are generated.
2. Extended Data: A correlation model is selected (Eqs. 2, 3, 4, and 5), and the value
of the dependent indicator Y 1 is evaluated for all objects.
3. Decision ranking: Ranking is performed using the original and extended data
(like the example in Table 2). This results in ordering the objects (assigned a
numerical rank) from top to bottom to represent the most and the least important
object.
4. Comparison: The rankings from original and extended data are compared using
the Spearman’s rank correlation coefficient (SRCC).
All the above steps and the simulation runs were implemented using MATLAB.
This included generation of the datasets, evaluation of dependency models, application of Copeland ranking, and finally the SRCC value. Random datasets included
sizes of up to 10 objects and 10 indicators, which is a suitable size for a typical
environmental assessment problem. The comparison is made using SRCC, the most
widely used measure of correlation or association between ranks. In statistics,
the SRCC is a non-parametric measure of rank correlation (statistical dependence
between the pairs rankings of two methods). It assesses how well the relationship
between two rankings can be described using a monotonic function. Naturally,
the SRCC between two variables will be high when observations have similar
ranking between the two variables (correlation of 1) and low when observations
have dissimilar or fully opposed ranking between the two variables (correlation of
−1).
The analysis started with 64 datasets. Each data item is ranked and then re-ranked
after the addition of four different dependent indicators one after another (a total
320 ranking runs). The results show that the rankings are not profoundly affected by
the addition of a correlated indicator, no matter whether they were linear and nonlinear. The average SRCC scores that resulted for linear, multi-linear, non-linear, and
complex correlations are 0.892, 0.894, 0.892, and 0.857, respectively. The multilinear having the highest SRCC means that if indicators exist in a decision-making
G. Al-Sharrah and H. M. S. Lababidi
3.3 Non-linear
Y 1 =
γ 1 X 1
1 + γ 2 X 2
+ ε 1
(4)
3.4 Complex
Y 1 = δ 1 e
−δ 2 X 1 (1 − δ 3 X 2 ) + ε 1
(5)
Equations (4) and (5) are examples of the nonlinear and complex models, respectively. Assessment of the proposed approach was carried out using the following
steps:
1. Original Data: A sequences of uncorrelated normally distributed random indicators X 1 , X 2 ... X n for hypothetical objects Obj 1 , Obj 2 . . . Obj m are generated.
2. Extended Data: A correlation model is selected (Eqs. 2, 3, 4, and 5), and the value
of the dependent indicator Y 1 is evaluated for all objects.
3. Decision ranking: Ranking is performed using the original and extended data
(like the example in Table 2). This results in ordering the objects (assigned a
numerical rank) from top to bottom to represent the most and the least important
object.
4. Comparison: The rankings from original and extended data are compared using
the Spearman’s rank correlation coefficient (SRCC).
All the above steps and the simulation runs were implemented using MATLAB.
This included generation of the datasets, evaluation of dependency models, application of Copeland ranking, and finally the SRCC value. Random datasets included
sizes of up to 10 objects and 10 indicators, which is a suitable size for a typical
environmental assessment problem. The comparison is made using SRCC, the most
widely used measure of correlation or association between ranks. In statistics,
the SRCC is a non-parametric measure of rank correlation (statistical dependence
between the pairs rankings of two methods). It assesses how well the relationship
between two rankings can be described using a monotonic function. Naturally,
the SRCC between two variables will be high when observations have similar
ranking between the two variables (correlation of 1) and low when observations
have dissimilar or fully opposed ranking between the two variables (correlation of
−1).
The analysis started with 64 datasets. Each data item is ranked and then re-ranked
after the addition of four different dependent indicators one after another (a total
320 ranking runs). The results show that the rankings are not profoundly affected by
the addition of a correlated indicator, no matter whether they were linear and nonlinear. The average SRCC scores that resulted for linear, multi-linear, non-linear, and
complex correlations are 0.892, 0.894, 0.892, and 0.857, respectively. The multilinear having the highest SRCC means that if indicators exist in a decision-making