

Dependent Indicators for Environmental Evaluations of Desalination Plants
123
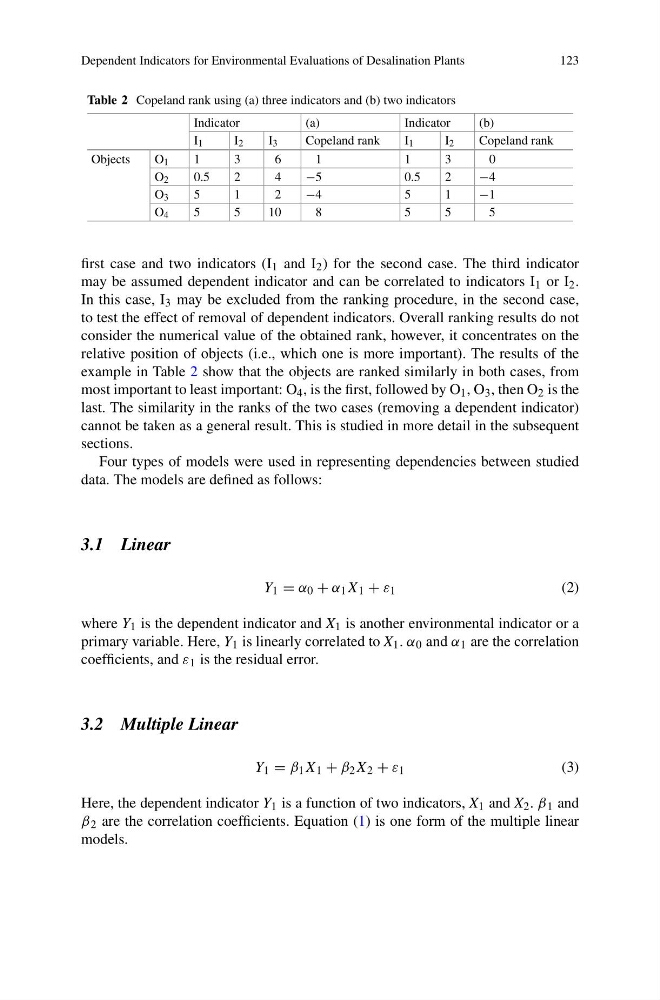
Table 2 Copeland rank using (a) three indicators and (b) two indicators
Indicator
(a)
Indicator
(b)
I 1
I 2
I 3
Copeland rank
I 1
I 2
Copeland rank
Objects
O 1
1
3
6
1
1
3
0
O 2
0.5
2
4
−5
0.5
2
−4
O 3
5
1
2
−4
5
1
−1
O 4
5
5
10
8
5
5
5
first case and two indicators (I 1 and I 2 ) for the second case. The third indicator
may be assumed dependent indicator and can be correlated to indicators I 1 or I 2 .
In this case, I 3 may be excluded from the ranking procedure, in the second case,
to test the effect of removal of dependent indicators. Overall ranking results do not
consider the numerical value of the obtained rank, however, it concentrates on the
relative position of objects (i.e., which one is more important). The results of the
example in Table 2 show that the objects are ranked similarly in both cases, from
most important to least important: O 4 , is the first, followed by O 1 , O 3 , then O 2 is the
last. The similarity in the ranks of the two cases (removing a dependent indicator)
cannot be taken as a general result. This is studied in more detail in the subsequent
sections.
Four types of models were used in representing dependencies between studied
data. The models are defined as follows:
3.1 Linear
Y 1 = α 0 + α 1 X 1 + ε 1
(2)
where Y 1 is the dependent indicator and X 1 is another environmental indicator or a
primary variable. Here, Y 1 is linearly correlated to X 1 . α 0 and α 1 are the correlation
coefficients, and ε 1 is the residual error.
3.2 Multiple Linear
Y 1 = β 1 X 1 + β 2 X 2 + ε 1
(3)
Here, the dependent indicator Y 1 is a function of two indicators, X 1 and X 2 . β 1 and
β 2 are the correlation coefficients. Equation (1) is one form of the multiple linear
models.
123
Table 2 Copeland rank using (a) three indicators and (b) two indicators
Indicator
(a)
Indicator
(b)
I 1
I 2
I 3
Copeland rank
I 1
I 2
Copeland rank
Objects
O 1
1
3
6
1
1
3
0
O 2
0.5
2
4
−5
0.5
2
−4
O 3
5
1
2
−4
5
1
−1
O 4
5
5
10
8
5
5
5
first case and two indicators (I 1 and I 2 ) for the second case. The third indicator
may be assumed dependent indicator and can be correlated to indicators I 1 or I 2 .
In this case, I 3 may be excluded from the ranking procedure, in the second case,
to test the effect of removal of dependent indicators. Overall ranking results do not
consider the numerical value of the obtained rank, however, it concentrates on the
relative position of objects (i.e., which one is more important). The results of the
example in Table 2 show that the objects are ranked similarly in both cases, from
most important to least important: O 4 , is the first, followed by O 1 , O 3 , then O 2 is the
last. The similarity in the ranks of the two cases (removing a dependent indicator)
cannot be taken as a general result. This is studied in more detail in the subsequent
sections.
Four types of models were used in representing dependencies between studied
data. The models are defined as follows:
3.1 Linear
Y 1 = α 0 + α 1 X 1 + ε 1
(2)
where Y 1 is the dependent indicator and X 1 is another environmental indicator or a
primary variable. Here, Y 1 is linearly correlated to X 1 . α 0 and α 1 are the correlation
coefficients, and ε 1 is the residual error.
3.2 Multiple Linear
Y 1 = β 1 X 1 + β 2 X 2 + ε 1
(3)
Here, the dependent indicator Y 1 is a function of two indicators, X 1 and X 2 . β 1 and
β 2 are the correlation coefficients. Equation (1) is one form of the multiple linear
models.