

122
G. Al-Sharrah and H. M. S. Lababidi
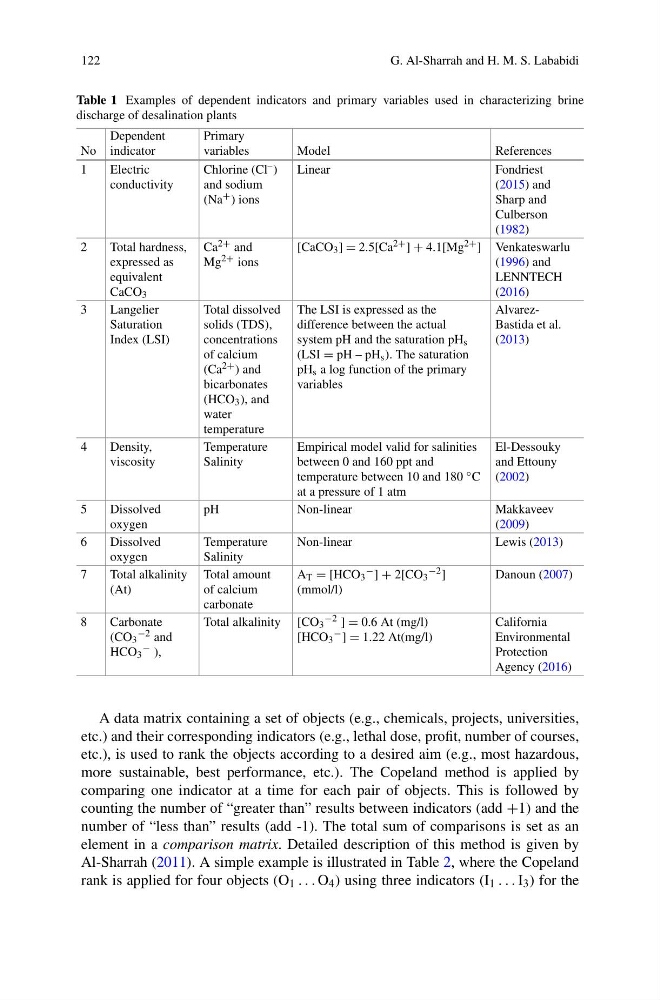
Table 1 Examples of dependent indicators and primary variables used in characterizing brine
discharge of desalination plants
No
Dependent
indicator
Primary
variables
Model
References
1
Electric
conductivity
Chlorine (Cl – )
and sodium
(Na + ) ions
Linear
Fondriest
(2015) and
Sharp and
Culberson
(1982)
2
Total hardness,
expressed as
equivalent
CaCO 3
Ca 2+ and
Mg 2+ ions
[CaCO 3 ] = 2.5[Ca 2+ ] + 4.1[Mg 2+ ] Venkateswarlu
(1996) and
LENNTECH
(2016)
3
Langelier
Saturation
Index (LSI)
Total dissolved
solids (TDS),
concentrations
of calcium
(Ca 2+ ) and
bicarbonates
(HCO 3 ), and
water
temperature
The LSI is expressed as the
difference between the actual
system pH and the saturation pH s
(LSI = pH – pH s ). The saturation
pH s a log function of the primary
variables
AlvarezBastida et al.
(2013)
4
Density,
viscosity
Temperature
Salinity
Empirical model valid for salinities
between 0 and 160 ppt and
temperature between 10 and 180 ◦ C
at a pressure of 1 atm
El-Dessouky
and Ettouny
(2002)
5
Dissolved
oxygen
pH
Non-linear
Makkaveev
(2009)
6
Dissolved
oxygen
Temperature
Salinity
Non-linear
Lewis (2013)
7
Total alkalinity
(At)
Total amount
of calcium
carbonate
A T = [HCO 3
− ] + 2[CO 3
−2 ]
(mmol/l)
Danoun (2007)
8
Carbonate
(CO 3
−2 and
HCO 3
− ),
Total alkalinity [CO 3
−2 ] = 0.6 At (mg/l)
[HCO 3
− ] = 1.22 At(mg/l)
California
Environmental
Protection
Agency (2016)
A data matrix containing a set of objects (e.g., chemicals, projects, universities,
etc.) and their corresponding indicators (e.g., lethal dose, profit, number of courses,
etc.), is used to rank the objects according to a desired aim (e.g., most hazardous,
more sustainable, best performance, etc.). The Copeland method is applied by
comparing one indicator at a time for each pair of objects. This is followed by
counting the number of “greater than” results between indicators (add +1) and the
number of “less than” results (add -1). The total sum of comparisons is set as an
element in a comparison matrix. Detailed description of this method is given by
Al-Sharrah (2011). A simple example is illustrated in Table 2, where the Copeland
rank is applied for four objects (O 1 . . . O 4 ) using three indicators (I 1 . . . I 3 ) for the
G. Al-Sharrah and H. M. S. Lababidi
Table 1 Examples of dependent indicators and primary variables used in characterizing brine
discharge of desalination plants
No
Dependent
indicator
Primary
variables
Model
References
1
Electric
conductivity
Chlorine (Cl – )
and sodium
(Na + ) ions
Linear
Fondriest
(2015) and
Sharp and
Culberson
(1982)
2
Total hardness,
expressed as
equivalent
CaCO 3
Ca 2+ and
Mg 2+ ions
[CaCO 3 ] = 2.5[Ca 2+ ] + 4.1[Mg 2+ ] Venkateswarlu
(1996) and
LENNTECH
(2016)
3
Langelier
Saturation
Index (LSI)
Total dissolved
solids (TDS),
concentrations
of calcium
(Ca 2+ ) and
bicarbonates
(HCO 3 ), and
water
temperature
The LSI is expressed as the
difference between the actual
system pH and the saturation pH s
(LSI = pH – pH s ). The saturation
pH s a log function of the primary
variables
AlvarezBastida et al.
(2013)
4
Density,
viscosity
Temperature
Salinity
Empirical model valid for salinities
between 0 and 160 ppt and
temperature between 10 and 180 ◦ C
at a pressure of 1 atm
El-Dessouky
and Ettouny
(2002)
5
Dissolved
oxygen
pH
Non-linear
Makkaveev
(2009)
6
Dissolved
oxygen
Temperature
Salinity
Non-linear
Lewis (2013)
7
Total alkalinity
(At)
Total amount
of calcium
carbonate
A T = [HCO 3
− ] + 2[CO 3
−2 ]
(mmol/l)
Danoun (2007)
8
Carbonate
(CO 3
−2 and
HCO 3
− ),
Total alkalinity [CO 3
−2 ] = 0.6 At (mg/l)
[HCO 3
− ] = 1.22 At(mg/l)
California
Environmental
Protection
Agency (2016)
A data matrix containing a set of objects (e.g., chemicals, projects, universities,
etc.) and their corresponding indicators (e.g., lethal dose, profit, number of courses,
etc.), is used to rank the objects according to a desired aim (e.g., most hazardous,
more sustainable, best performance, etc.). The Copeland method is applied by
comparing one indicator at a time for each pair of objects. This is followed by
counting the number of “greater than” results between indicators (add +1) and the
number of “less than” results (add -1). The total sum of comparisons is set as an
element in a comparison matrix. Detailed description of this method is given by
Al-Sharrah (2011). A simple example is illustrated in Table 2, where the Copeland
rank is applied for four objects (O 1 . . . O 4 ) using three indicators (I 1 . . . I 3 ) for the