

Dependent Indicators for Environmental Evaluations of Desalination Plants
125
0
0.1
0.2
0.3
0.4
0.5
0.6
0.7
0.8
0.9
1
0
1
2
3
4
Spearman Rank Correlation Coefficent
Ratio (number of indicators/number of objects)
R linear
R multi linear
R nonlinear
R complex
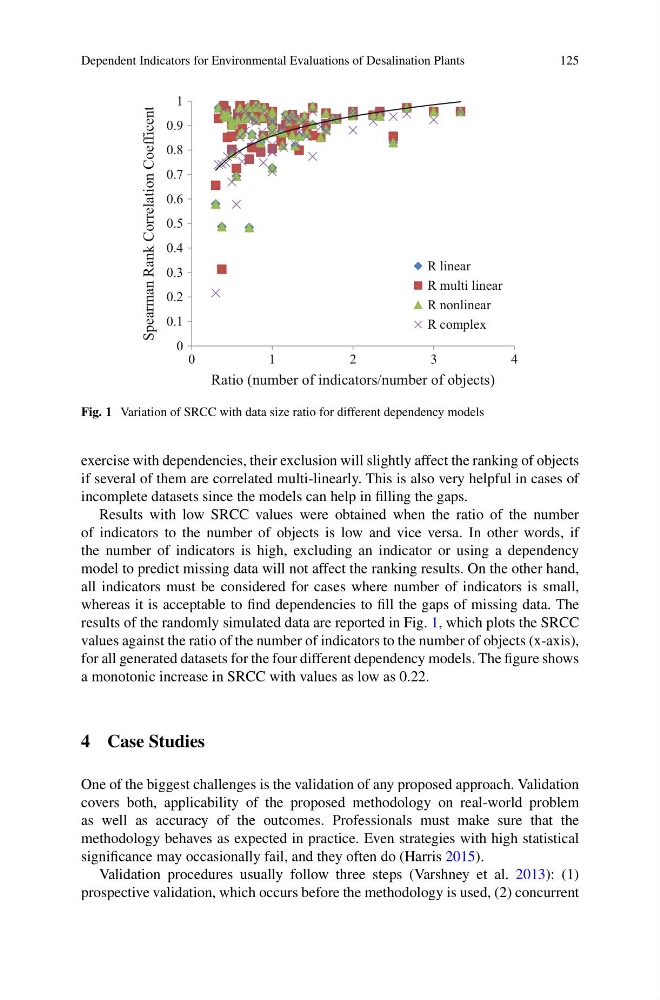
Fig. 1 Variation of SRCC with data size ratio for different dependency models
exercise with dependencies, their exclusion will slightly affect the ranking of objects
if several of them are correlated multi-linearly. This is also very helpful in cases of
incomplete datasets since the models can help in filling the gaps.
Results with low SRCC values were obtained when the ratio of the number
of indicators to the number of objects is low and vice versa. In other words, if
the number of indicators is high, excluding an indicator or using a dependency
model to predict missing data will not affect the ranking results. On the other hand,
all indicators must be considered for cases where number of indicators is small,
whereas it is acceptable to find dependencies to fill the gaps of missing data. The
results of the randomly simulated data are reported in Fig. 1, which plots the SRCC
values against the ratio of the number of indicators to the number of objects (x-axis),
for all generated datasets for the four different dependency models. The figure shows
a monotonic increase in SRCC with values as low as 0.22.
4 Case Studies
One of the biggest challenges is the validation of any proposed approach. Validation
covers both, applicability of the proposed methodology on real-world problem
as well as accuracy of the outcomes. Professionals must make sure that the
methodology behaves as expected in practice. Even strategies with high statistical
significance may occasionally fail, and they often do (Harris 2015).
Validation procedures usually follow three steps (Varshney et al. 2013): (1)
prospective validation, which occurs before the methodology is used, (2) concurrent
125
0
0.1
0.2
0.3
0.4
0.5
0.6
0.7
0.8
0.9
1
0
1
2
3
4
Spearman Rank Correlation Coefficent
Ratio (number of indicators/number of objects)
R linear
R multi linear
R nonlinear
R complex
Fig. 1 Variation of SRCC with data size ratio for different dependency models
exercise with dependencies, their exclusion will slightly affect the ranking of objects
if several of them are correlated multi-linearly. This is also very helpful in cases of
incomplete datasets since the models can help in filling the gaps.
Results with low SRCC values were obtained when the ratio of the number
of indicators to the number of objects is low and vice versa. In other words, if
the number of indicators is high, excluding an indicator or using a dependency
model to predict missing data will not affect the ranking results. On the other hand,
all indicators must be considered for cases where number of indicators is small,
whereas it is acceptable to find dependencies to fill the gaps of missing data. The
results of the randomly simulated data are reported in Fig. 1, which plots the SRCC
values against the ratio of the number of indicators to the number of objects (x-axis),
for all generated datasets for the four different dependency models. The figure shows
a monotonic increase in SRCC with values as low as 0.22.
4 Case Studies
One of the biggest challenges is the validation of any proposed approach. Validation
covers both, applicability of the proposed methodology on real-world problem
as well as accuracy of the outcomes. Professionals must make sure that the
methodology behaves as expected in practice. Even strategies with high statistical
significance may occasionally fail, and they often do (Harris 2015).
Validation procedures usually follow three steps (Varshney et al. 2013): (1)
prospective validation, which occurs before the methodology is used, (2) concurrent